Collector Health Monitoring
Collector health monitoring shows the runtime health of each collector on the Collector Management page. Every collector samples its own host and JVM resources on a schedule and sends the readings to the Forward Platform. The platform stores the readings, raises a warning when a collector runs low on available CPU, memory, or disk, and plots recent history as charts.
Navigation
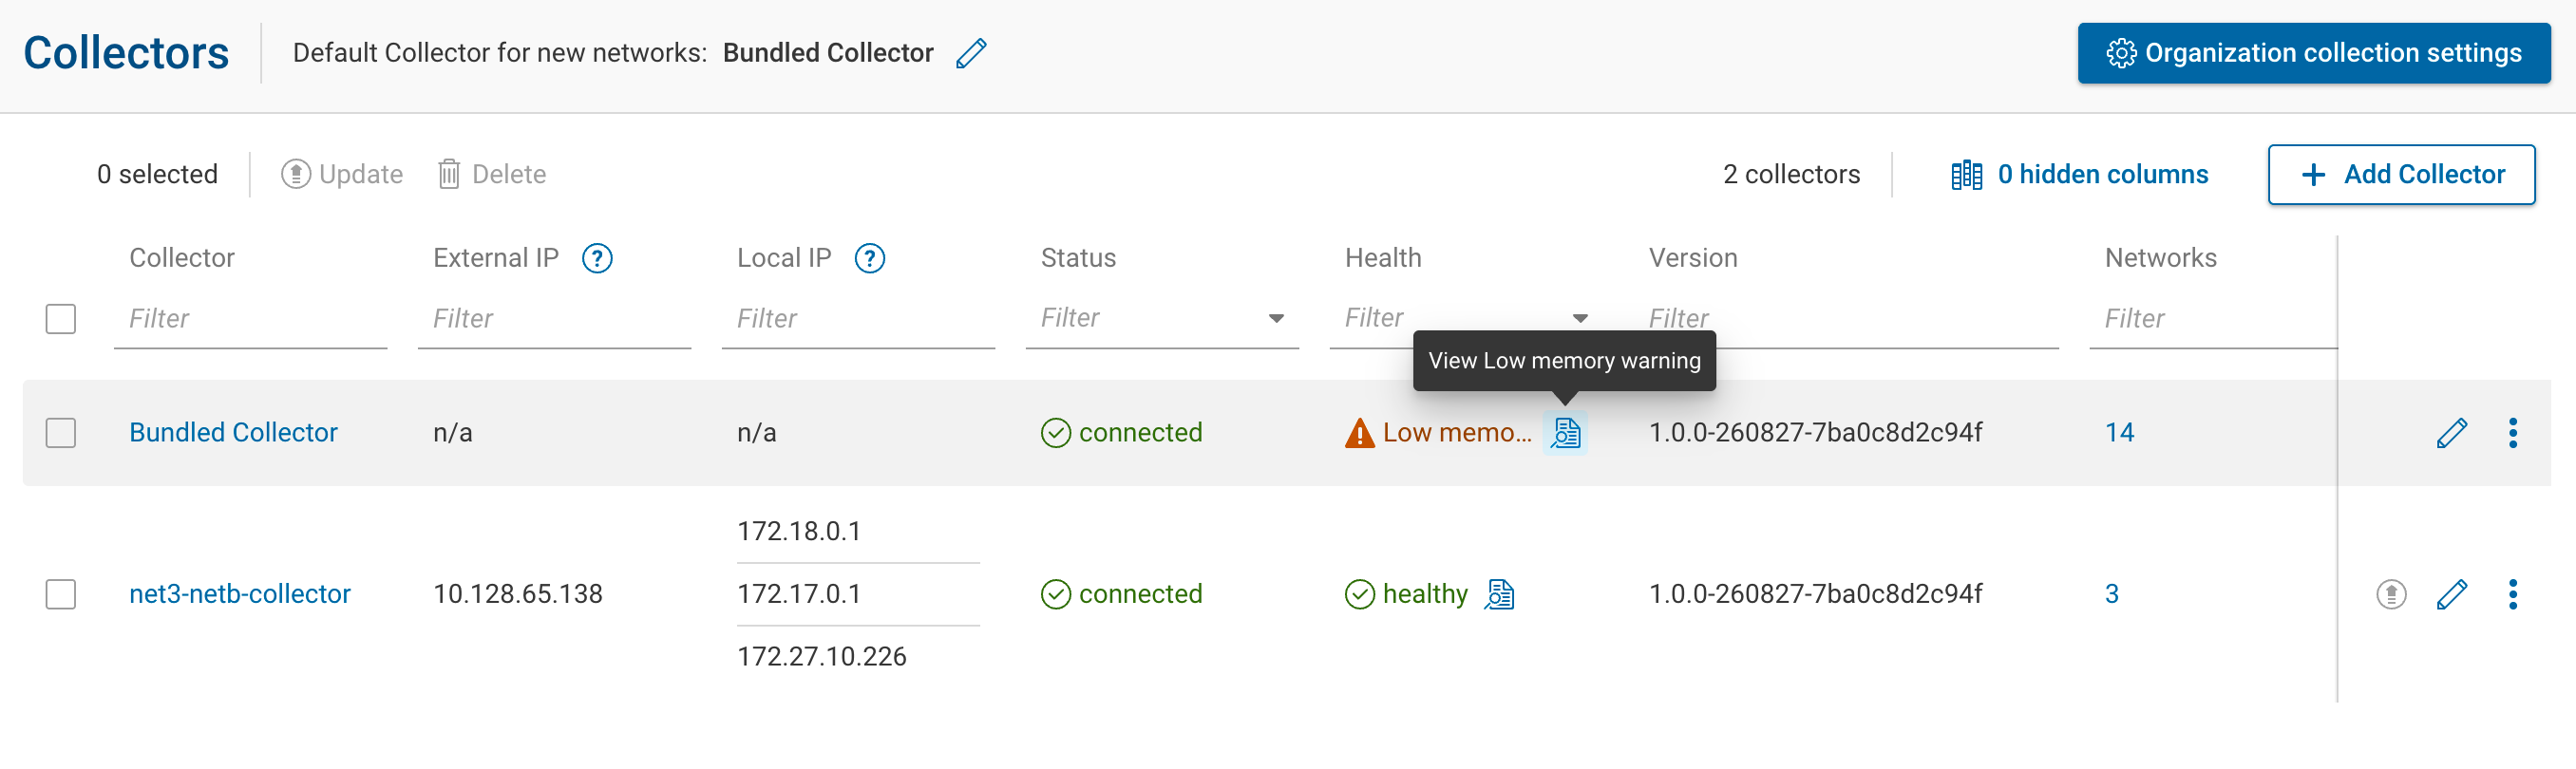
Collector health appears in the Health column of the Collector Management page, under Platform → Collectors in the left-hand navigation menu.
Health Status Column
The Health column shows one status tag per collector:
| Status | Meaning |
|---|---|
| Healthy | The collector reported recently and has no active resource warning. |
| High CPU / Low memory / Low disk | The collector has one or more active warnings. Each condition shows as its own tag. |
| Unknown | The collector has no active warning and has not reported in over an hour, so its current health is unknown. |
A collector with more than one active warning shows a separate tag for each condition, stacked in the order High CPU, Low memory, Low disk.
Any user who can view collectors sees the status tag. Opening the charts behind it (see Health Details Drawer) requires the collector-debugging permission: Org Admins have it, and an Org Admin can grant it to other users through a role that includes it.
Health Details Drawer
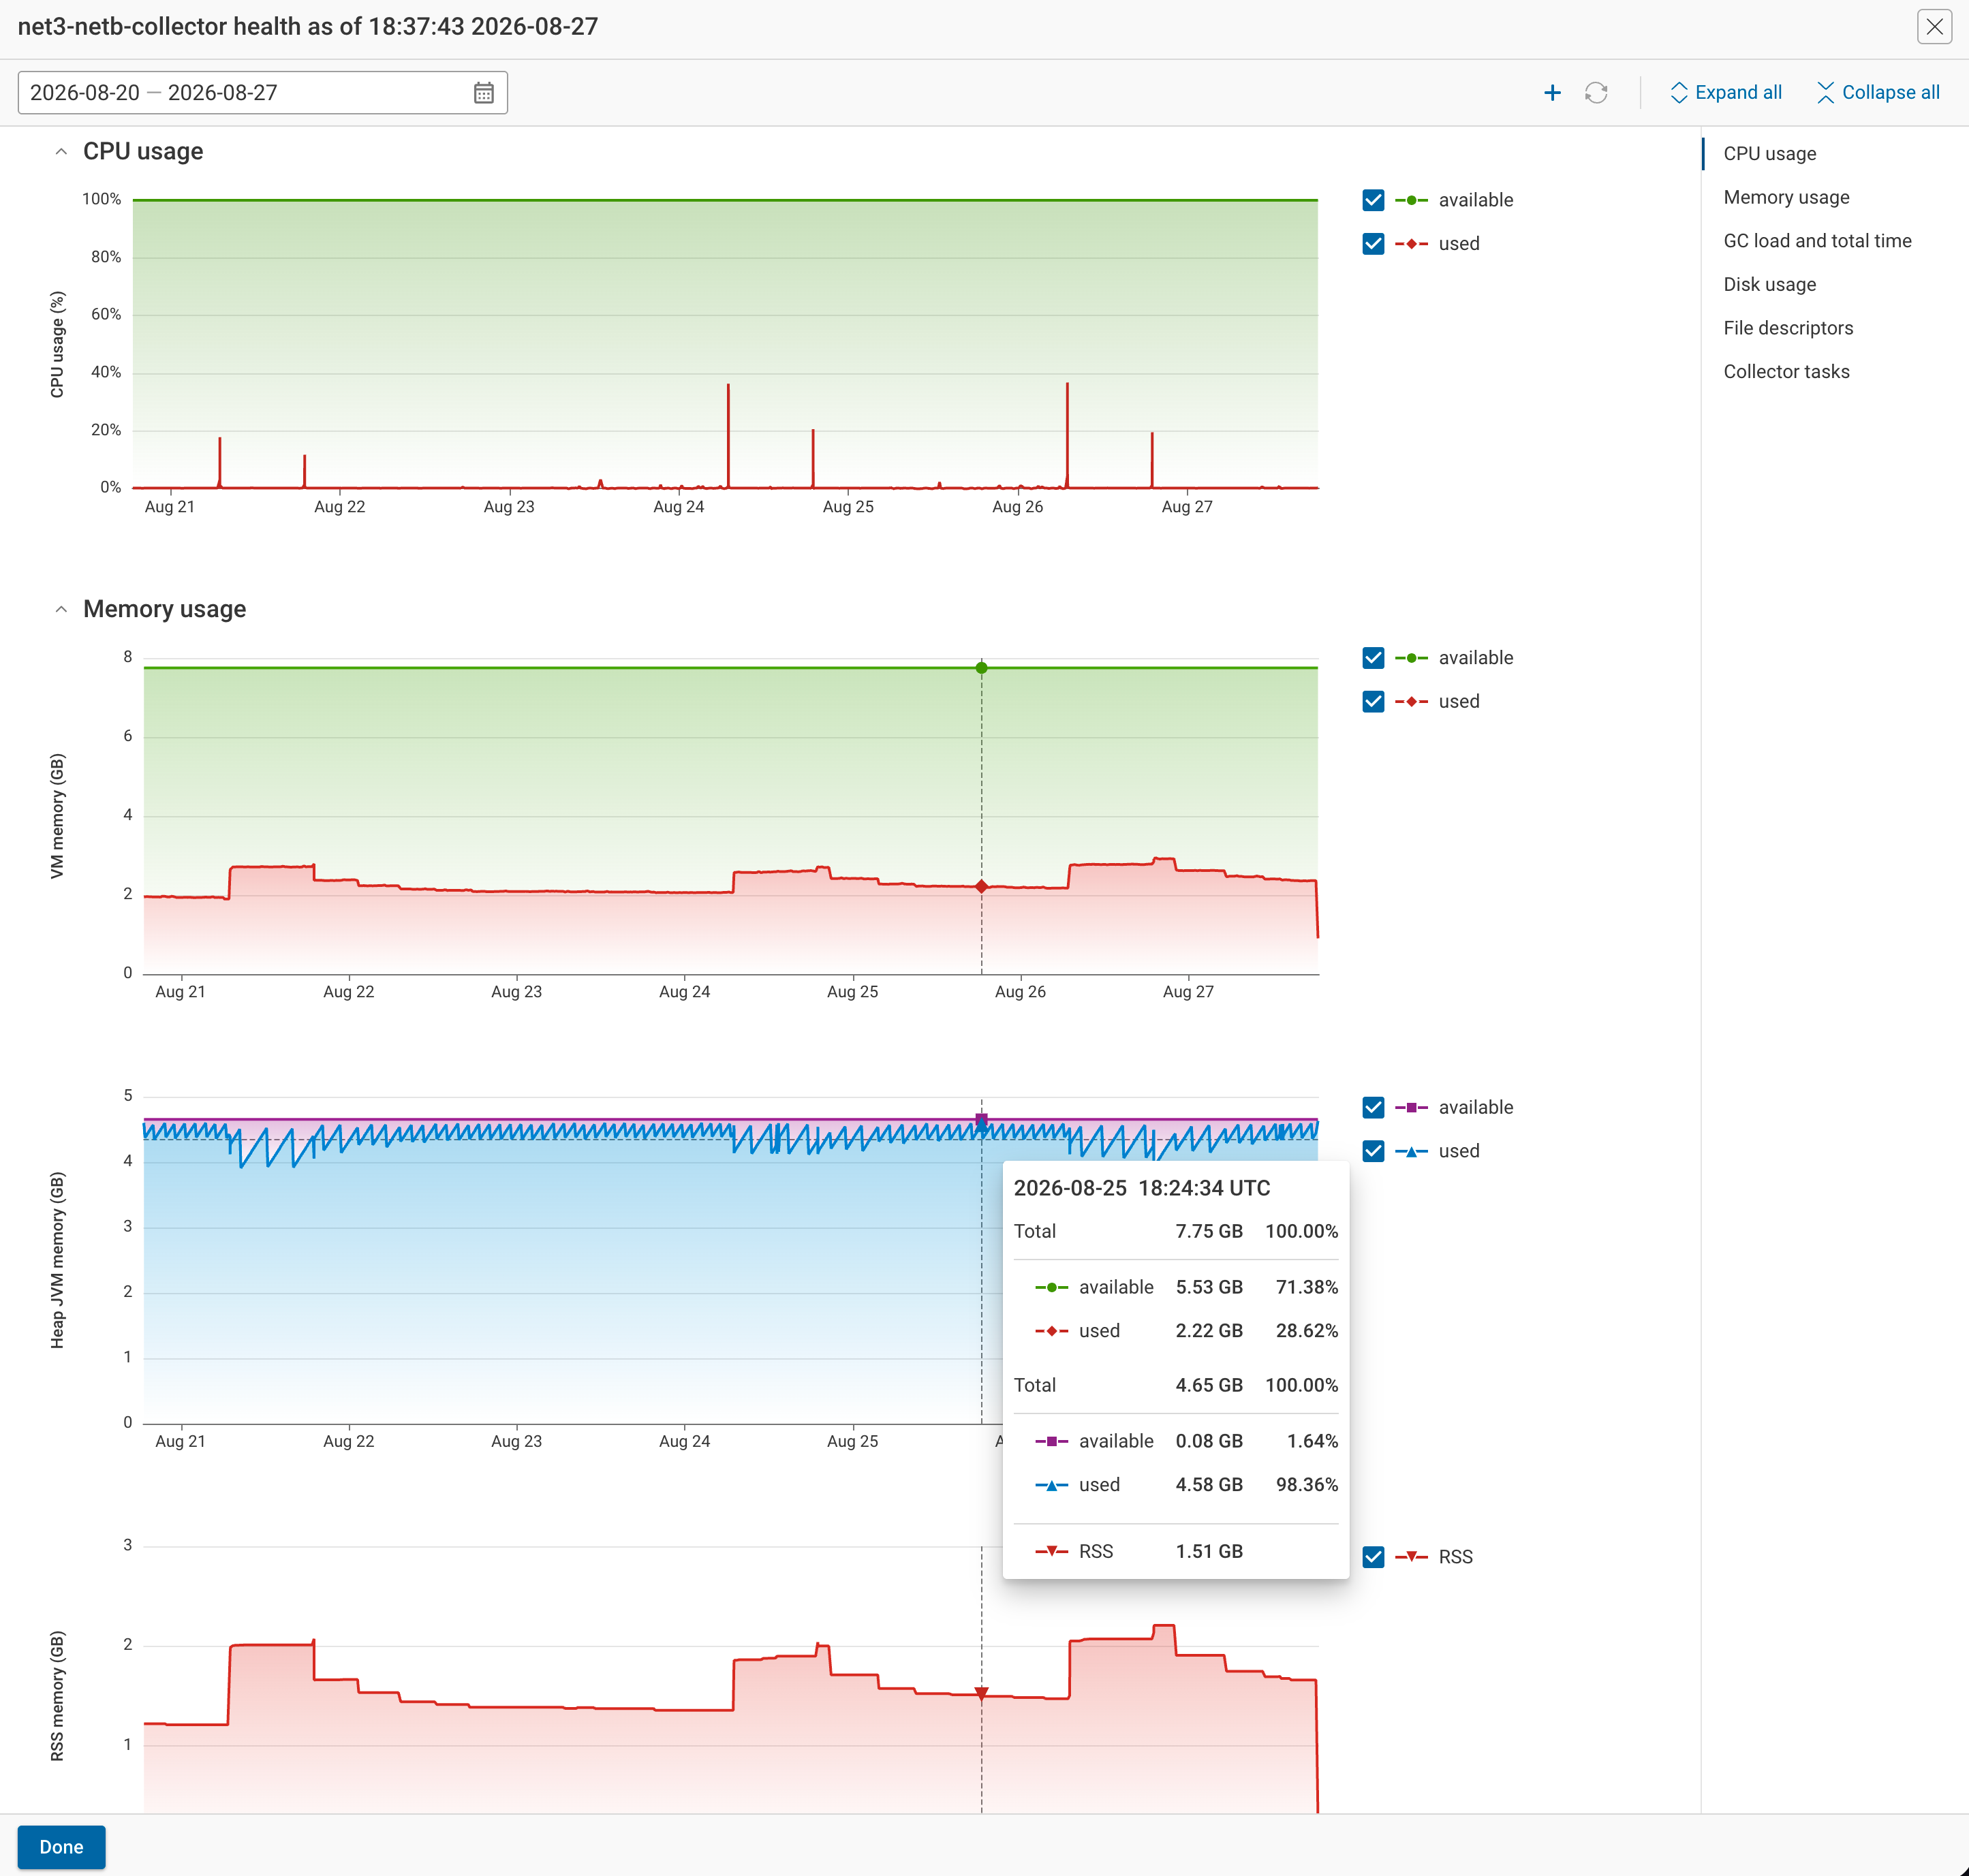
Click View health metrics on a healthy or unknown tag — or View <condition> warning on a warning tag — to open the health details drawer. Opening it from a warning jumps straight to that condition's charts and zooms the time axis to the period the warning covered.
The drawer header reads <collector name> health as of <time> <date>, marking when the data was loaded.
Toolbar
| Control | Purpose |
|---|---|
| Health Date Range | Set the time span to plot. Choose the last week or the last month, or pick a custom range within the last month. |
| Zoom controls | Drag across a chart to zoom into a shorter interval; reset returns every chart to the selected date range. |
| Expand all / Collapse all | Open or close every metric section at once. |
Zooming one chart applies the same time range to all of them, so every section stays aligned on the same window.
Metric Sections
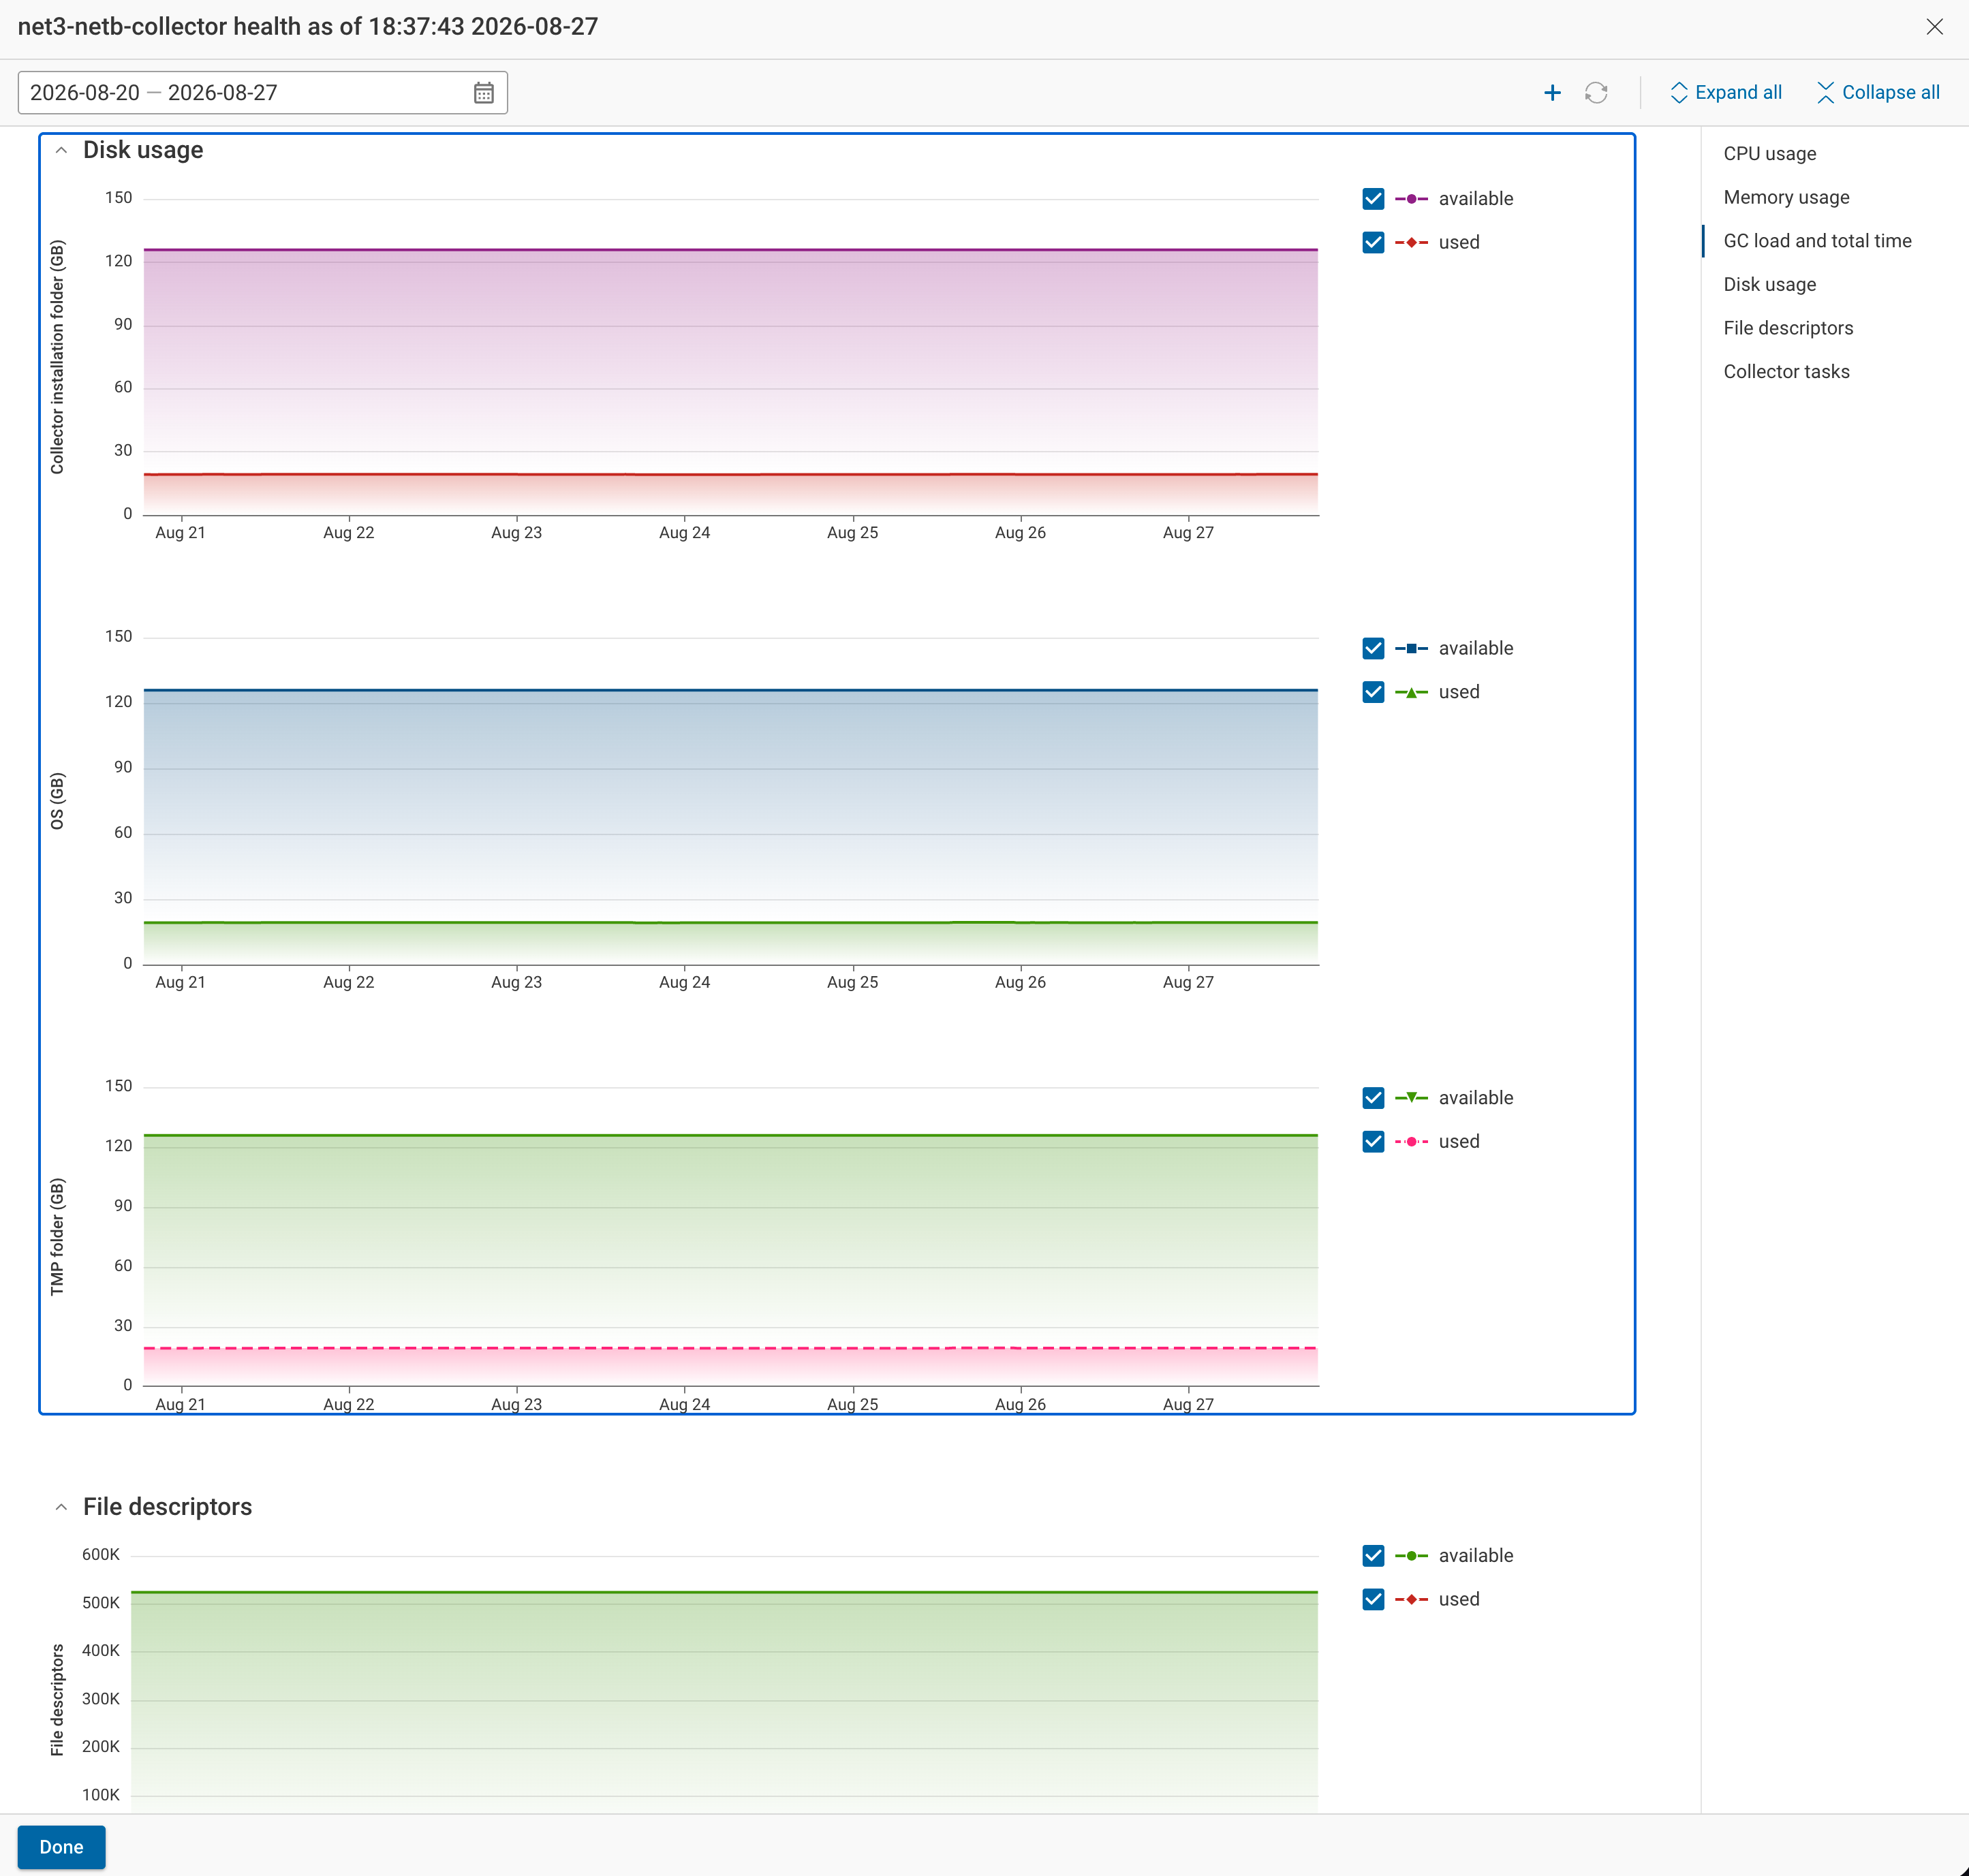
The drawer groups the charts into sections. A section with an active warning shows a warning icon next to its heading. Most charts plot used against available capacity over time.
| Section | Charts |
|---|---|
| CPU usage | CPU load, split into used and available. |
| Memory usage | Three charts: host (VM) memory, JVM heap memory, and process resident set size (RSS), each in GB. |
| GC load and total time | Garbage-collection load (share of time spent collecting) and cumulative GC time. |
| Disk usage | Three charts, one per monitored location: the collector installation folder, the OS root volume, and the temp folder, each in GB. |
| File descriptors | Open file descriptors against the process limit. |
| Collector tasks | Tasks in progress, worker thread pool concurrency, and worker thread pool queue size. |
How Health Status Is Determined
The collector samples its resources as often as every 30 seconds and sends the readings to the platform. Each reading updates the collector's health. While a collector is idle it reports less often, so readings arrive further apart until it runs a collection again.
A collector raises a warning under any of these conditions:
| Warning | Condition |
|---|---|
| High CPU | CPU load stays above 90%. |
| Low memory | Free host memory drops below 1 GB or below 10% of total memory, whichever is larger. |
| Low disk | Free space on the collector installation folder, the OS root volume, or the temp folder drops below 2 GB or below 10% of that volume, whichever is larger. |
A single spike does not raise a warning. A warning appears only after the condition holds for at least 60% of a recent span of samples, and it clears once the condition holds for 40% of that span or less. The gap between these two thresholds keeps a fluctuating resource from switching a warning on and off repeatedly.
After a condition clears, its warning stays on the collector for another 24 hours so a recent problem remains visible, then disappears.
A collector reads as Healthy when it has no active warning and reported within the last hour. It reads as Unknown when it has no active warning but has not reported for over an hour — for example, while it is disconnected.
Data Collection and Resource Use
Each collector gathers the metrics shown in Metric Sections from its own host and JVM: CPU load and host memory from the operating system, heap and garbage-collection figures from the JVM, disk usage from the filesystem, and task counts from the collector's own worker pool. Sampling reads these local counters only — it never contacts a network device.
Operating system differences
The collector reports the same metrics on Windows, Linux, and macOS, with one exception: file-descriptor counts come from a Unix-only interface, so they are available on Linux and macOS but not on Windows. On a Windows collector the File descriptors chart stays at zero; every other chart is populated as usual.
How samples reach the platform
Samples travel to the Forward Platform over the collector's existing outbound HTTPS connection — the same connection the collector already uses for collection. No extra port or firewall rule is needed, and each sample is a small, gzip-compressed message. While the collector is running collections it sends a sample about every 30 seconds; while idle it sends one about every 10 minutes so its health stays current.
Effect on collection and device polling
Sampling has no measurable effect on collection:
- It runs on a separate background thread that reads local CPU, memory, disk, and JVM counters. It submits no work to the collection worker pool, so collection jobs and connectivity tests never wait behind it.
- It never opens a device connection, so it does not compete with SNMP polling or any other device collection.
- Its only shared cost is a brief local reading each cycle and a small upload, both negligible next to a collection run.
Storage on the Forward Platform
The Forward Platform keeps one small record per sample per collector and deletes records after 30 days. When it draws a chart it downsamples the stored series, so even a month-long range renders quickly. Deleting a collector also removes its stored metrics.
Collector Debug Actions
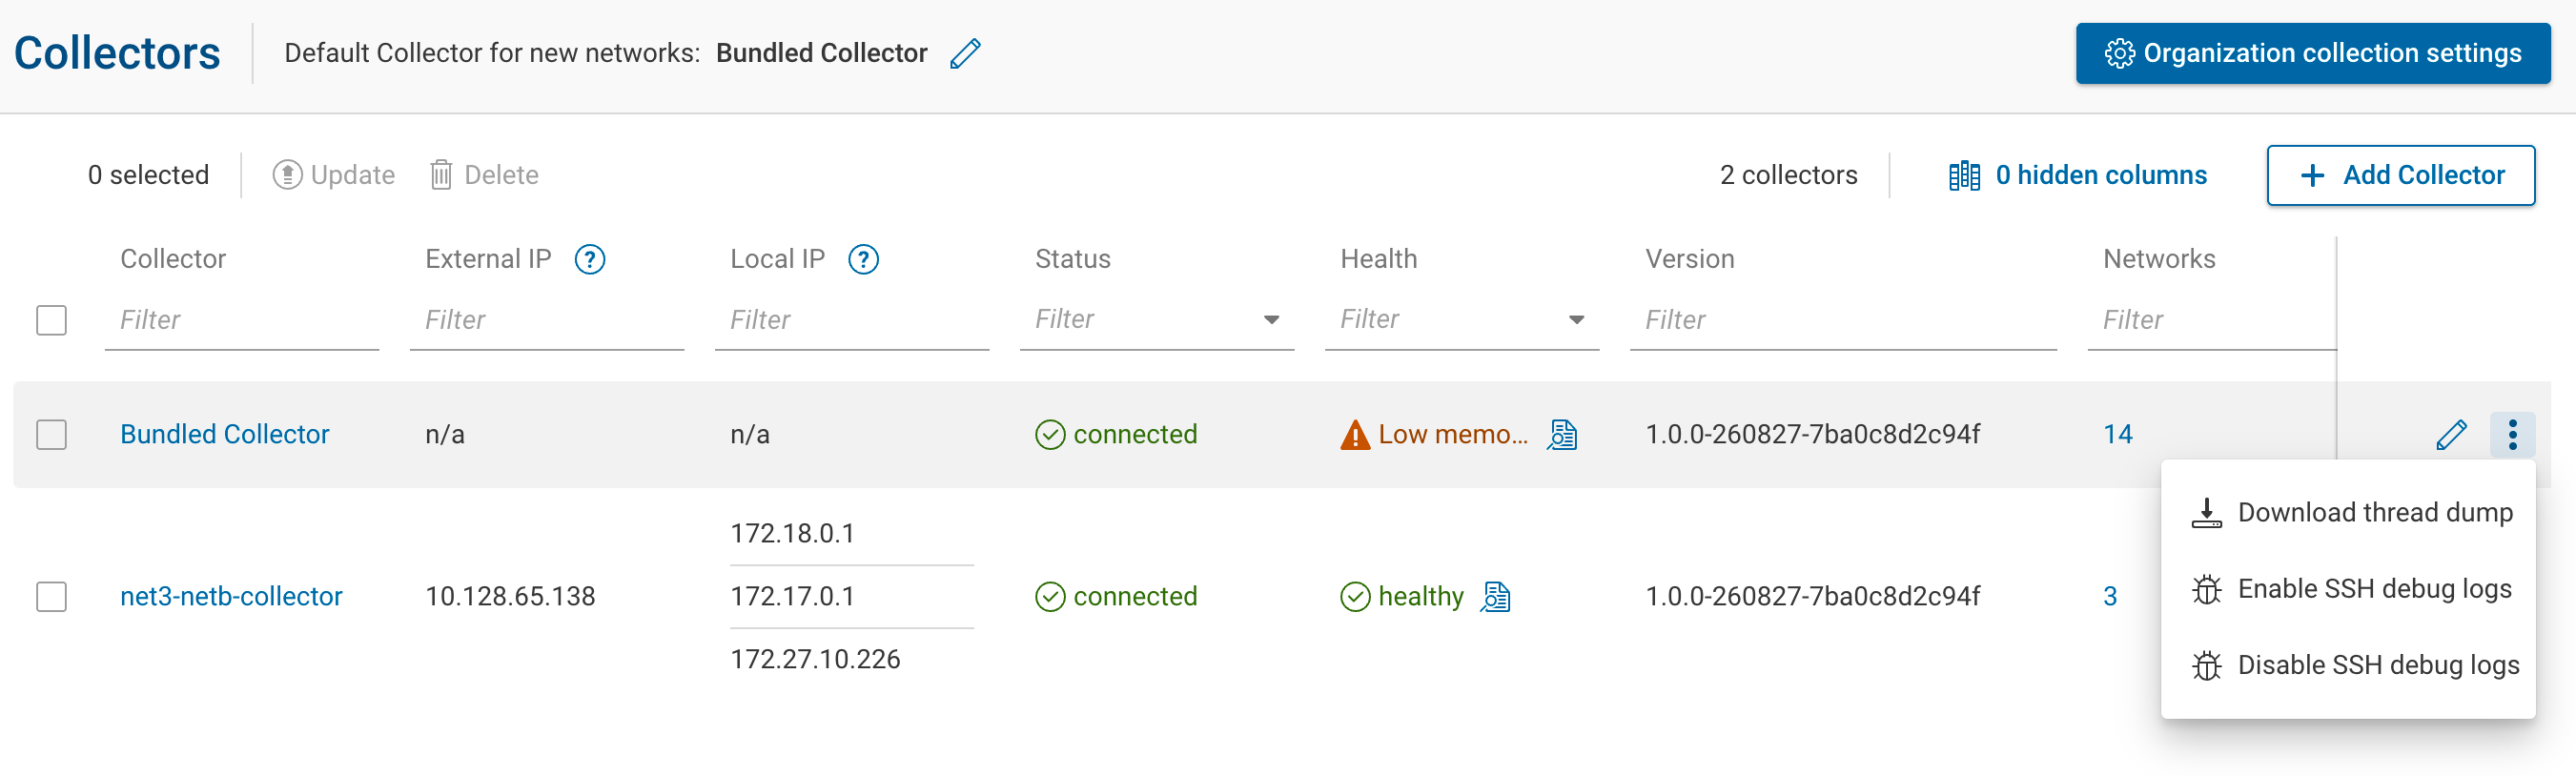
For Org Admins — and any other user whose role includes the collector-debugging permission — the row action menu for each connected collector adds diagnostic actions:
- Download thread dump — capture a JVM thread dump from the collector.
- Enable SSH debug logs / Disable SSH debug logs — turn verbose SSH logging on the collector on or off.
Related Pages
- Collector Management — manage collectors, versions, and assignments.
- Collector Jobs — watch queued and running collection jobs.
- Collector Logs — retrieve collector logs.
- Troubleshooting — diagnose a collector that is down or restarting.