Dashboards
The Forward Enterprise Dashboard provides insights into a network's complexity and health over time.
The information provided on this page allows for senior leaders to establish targets and goals that focus on monitoring and improving the overall network reliability, correctness, and hygiene on a regular basis.
Customizable Dashboards
Users can create customizable dashboards by selecting panels from existing Forward-maintained dashboards or user-defined scorecards. Users can organize their dashboards by adding custom rows and moving panels to suit their preferences. Dashboards can also be pinned for quick access from the Dashboard page.
Only Org Admins, Network Admins, and Dashboard Creators can build a customizable dashboard using panels from existing dashboards or user-defined scorecard panels. These users can name the dashboards and pin individual dashboards for easy navigation and access from the Dashboard page.
Adding a New Dashboard
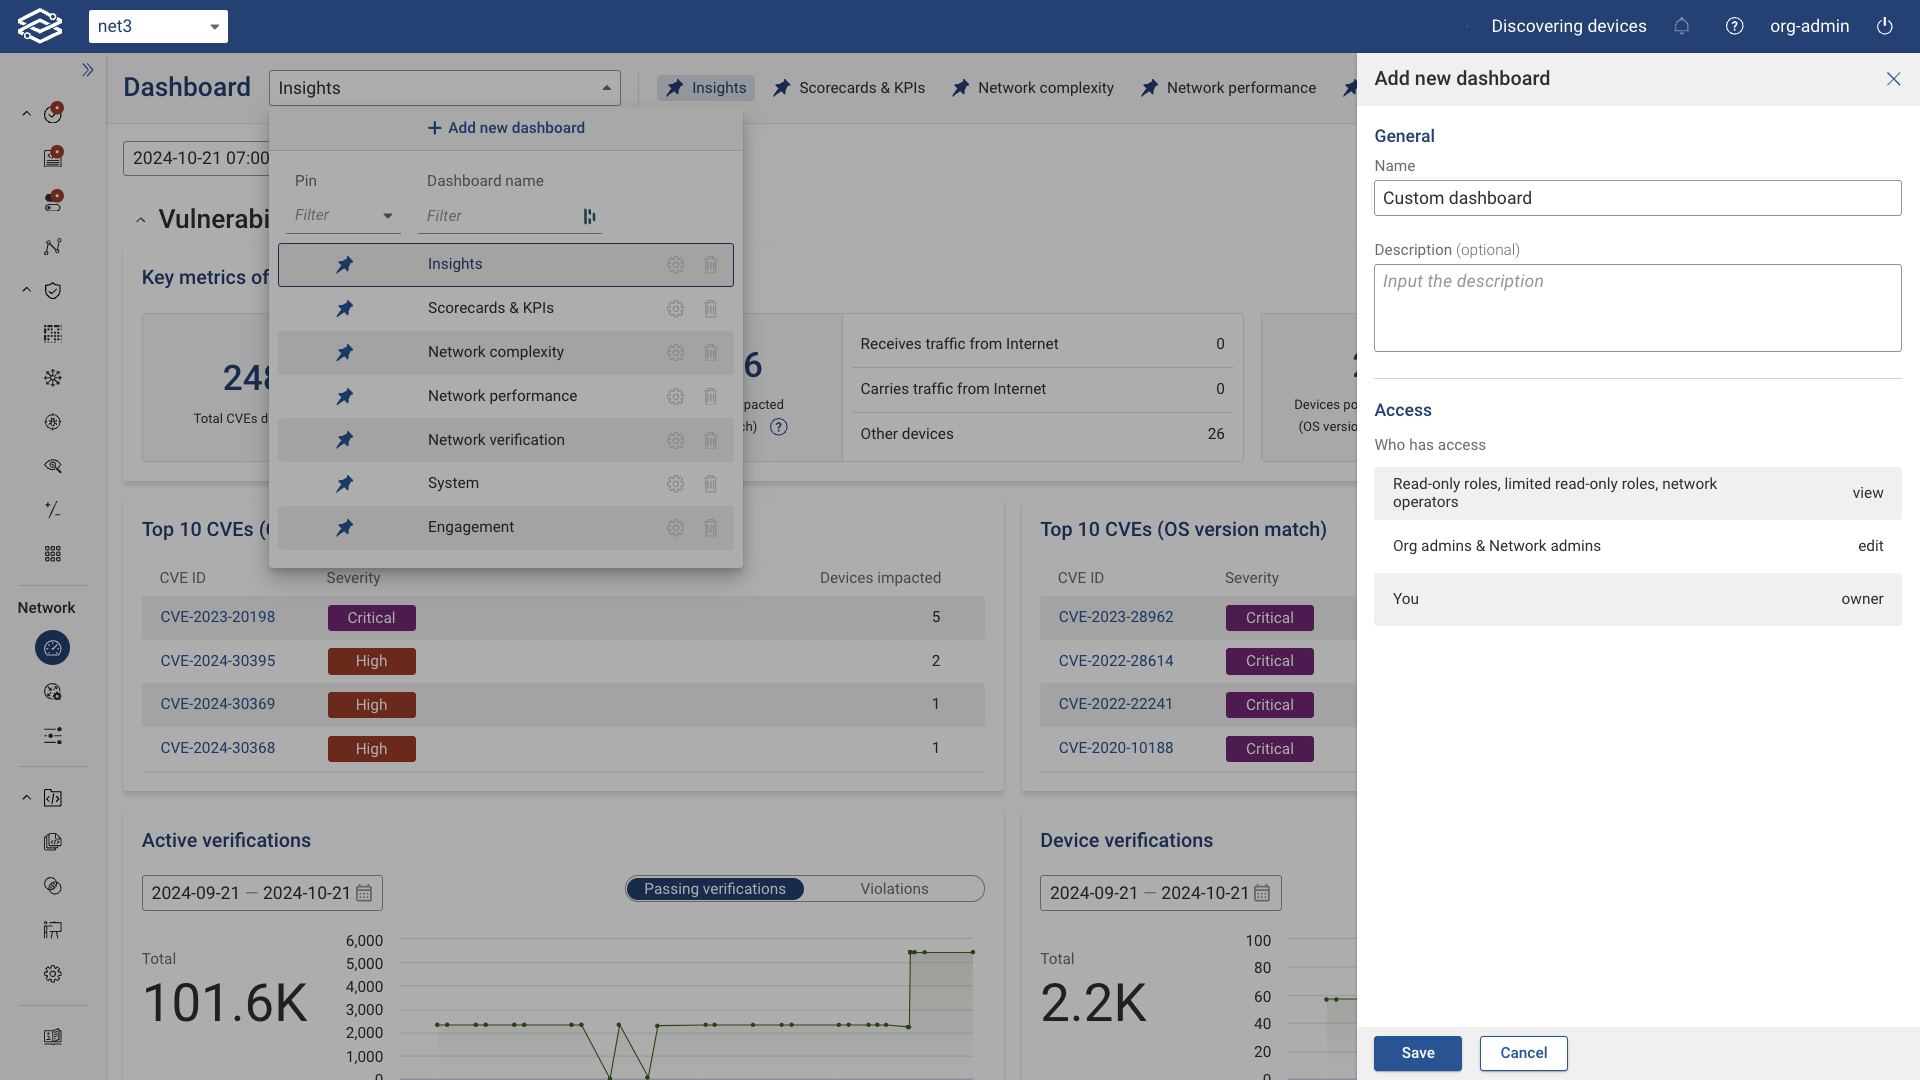
To create a custom dashboard, click the Dashboard Selector dropdown and select Add new dashboard. Provide a name and an optional description for the dashboard, then click Save.
Customizing a Dashboard
Add a New Panel
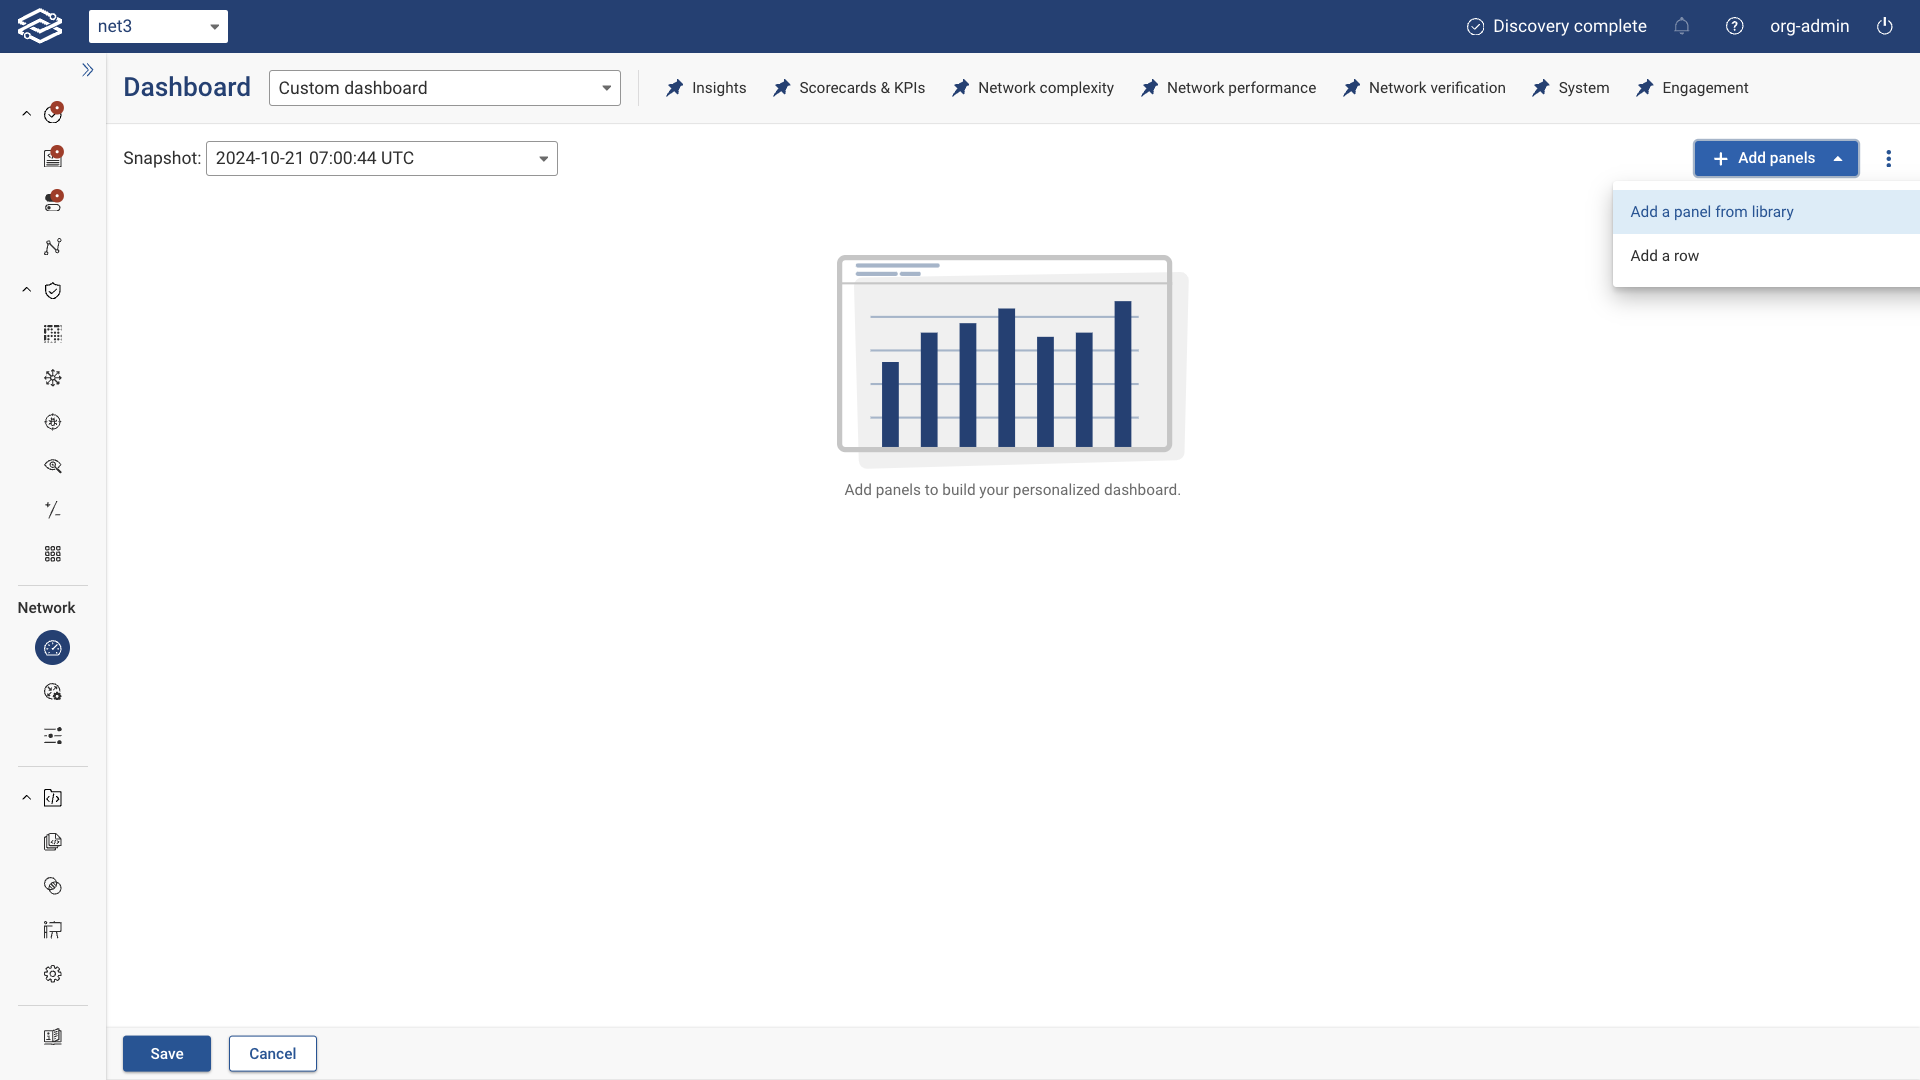
To add a new panel to your dashboard, click the Add panels dropdown and select Add a panel from library.
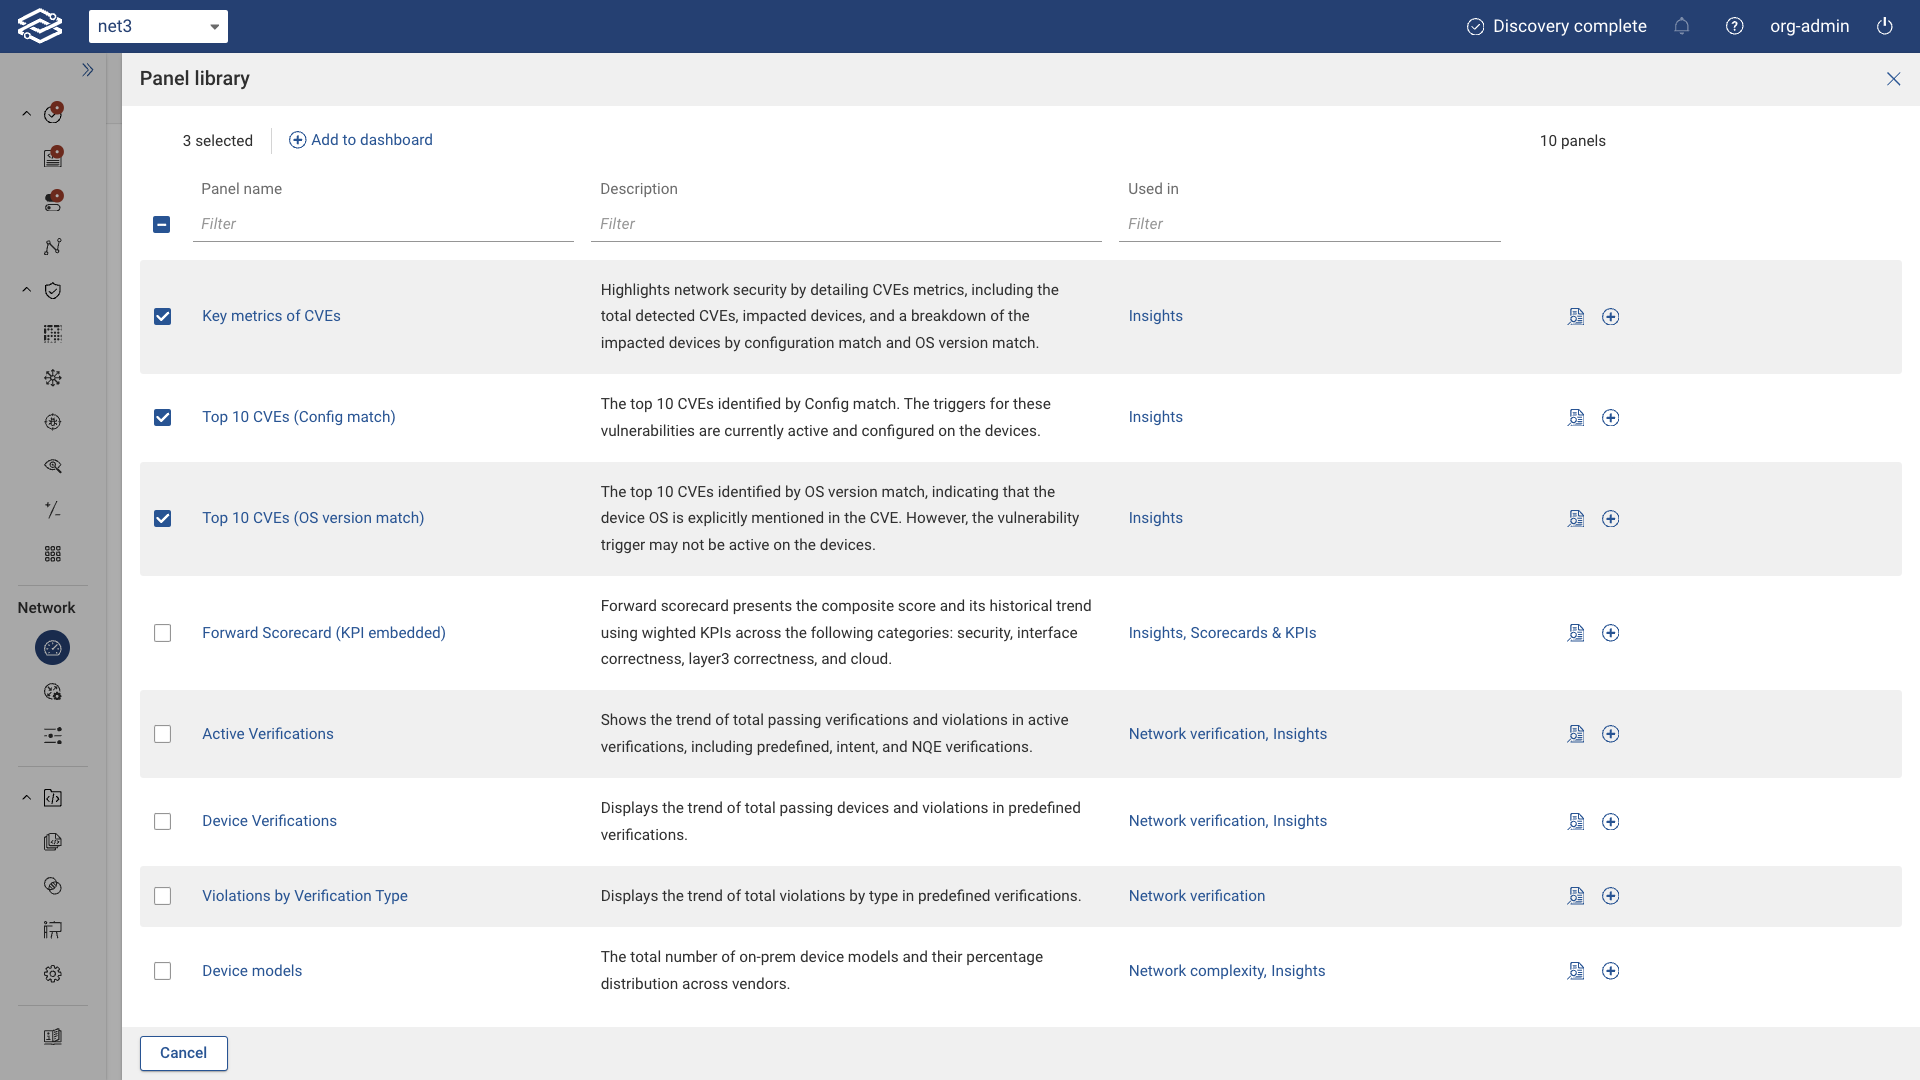
Choose panels from the Panel Library to include in your custom dashboard. Panels can be added individually or in bulk.
Moving a Panel
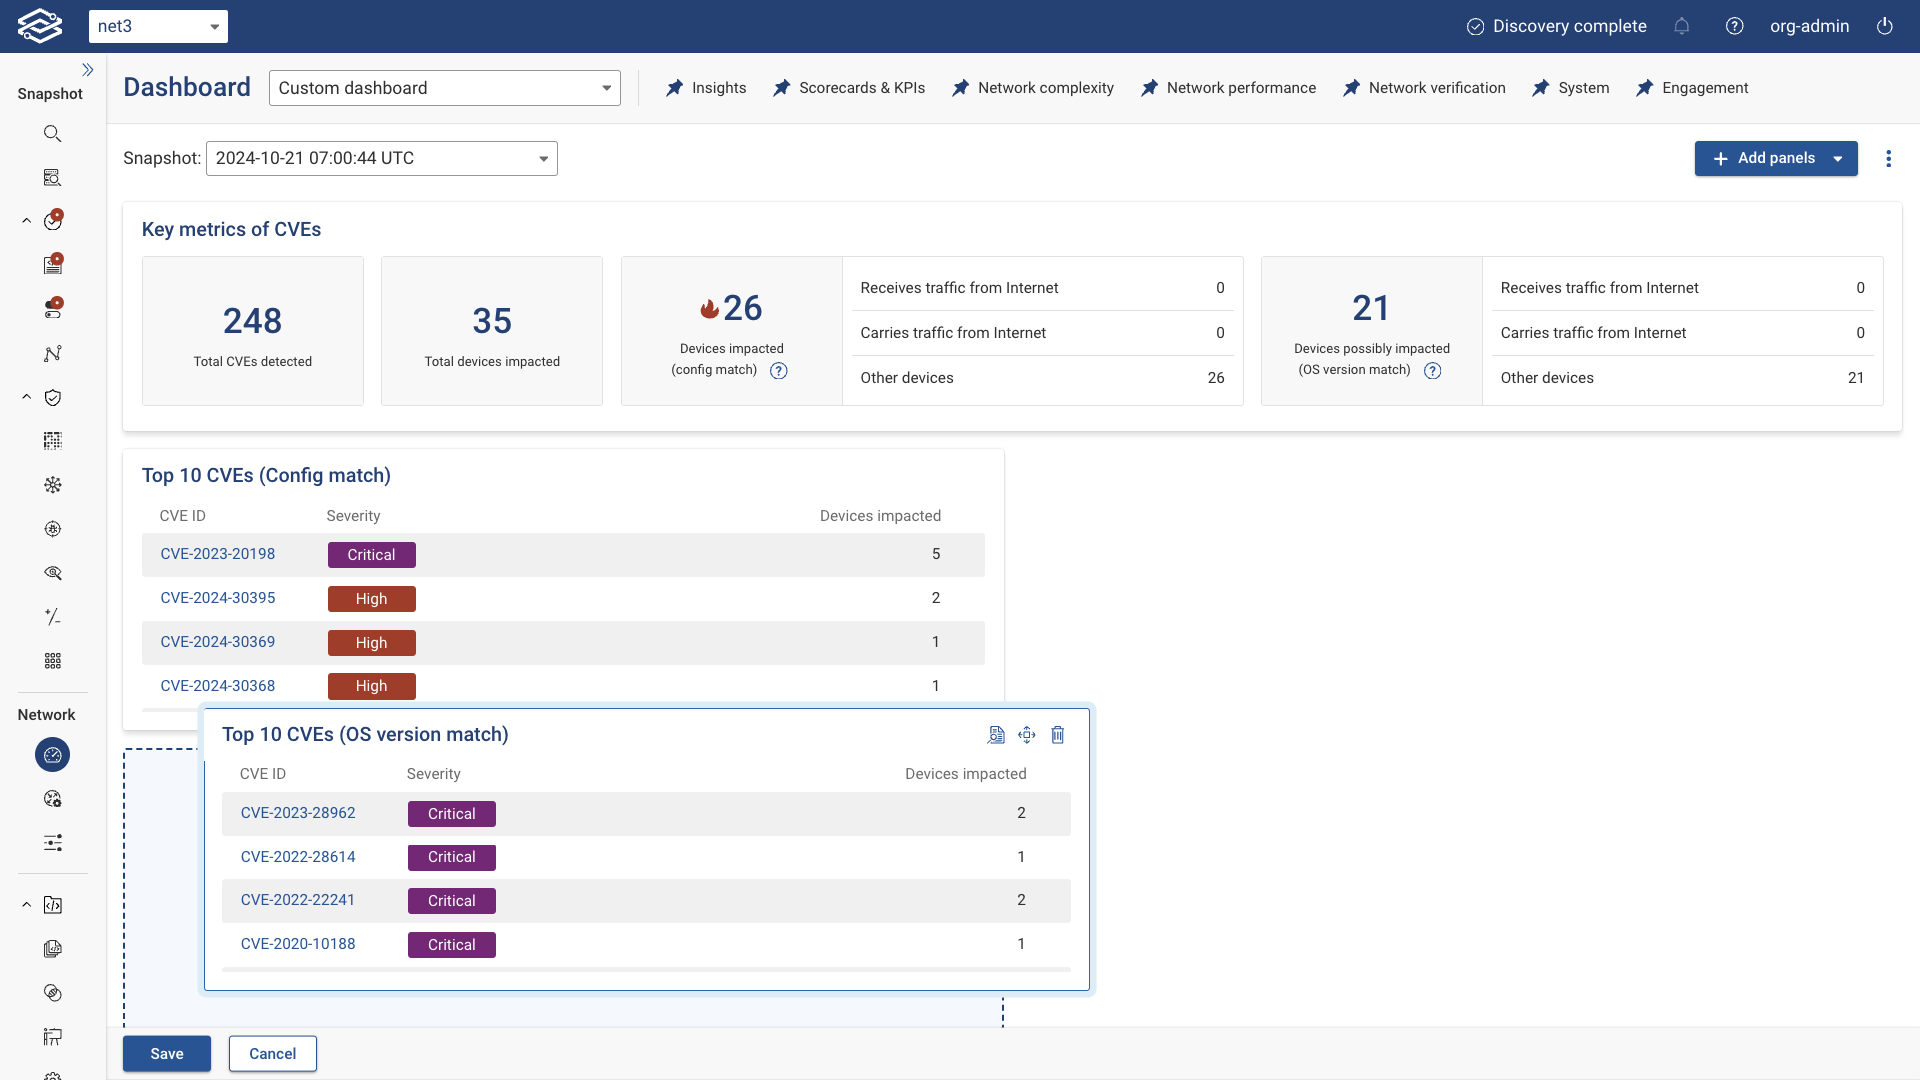
To rearrange panels, click and hold the Drag to Move icon, then move the panel to your desired location on the dashboard.
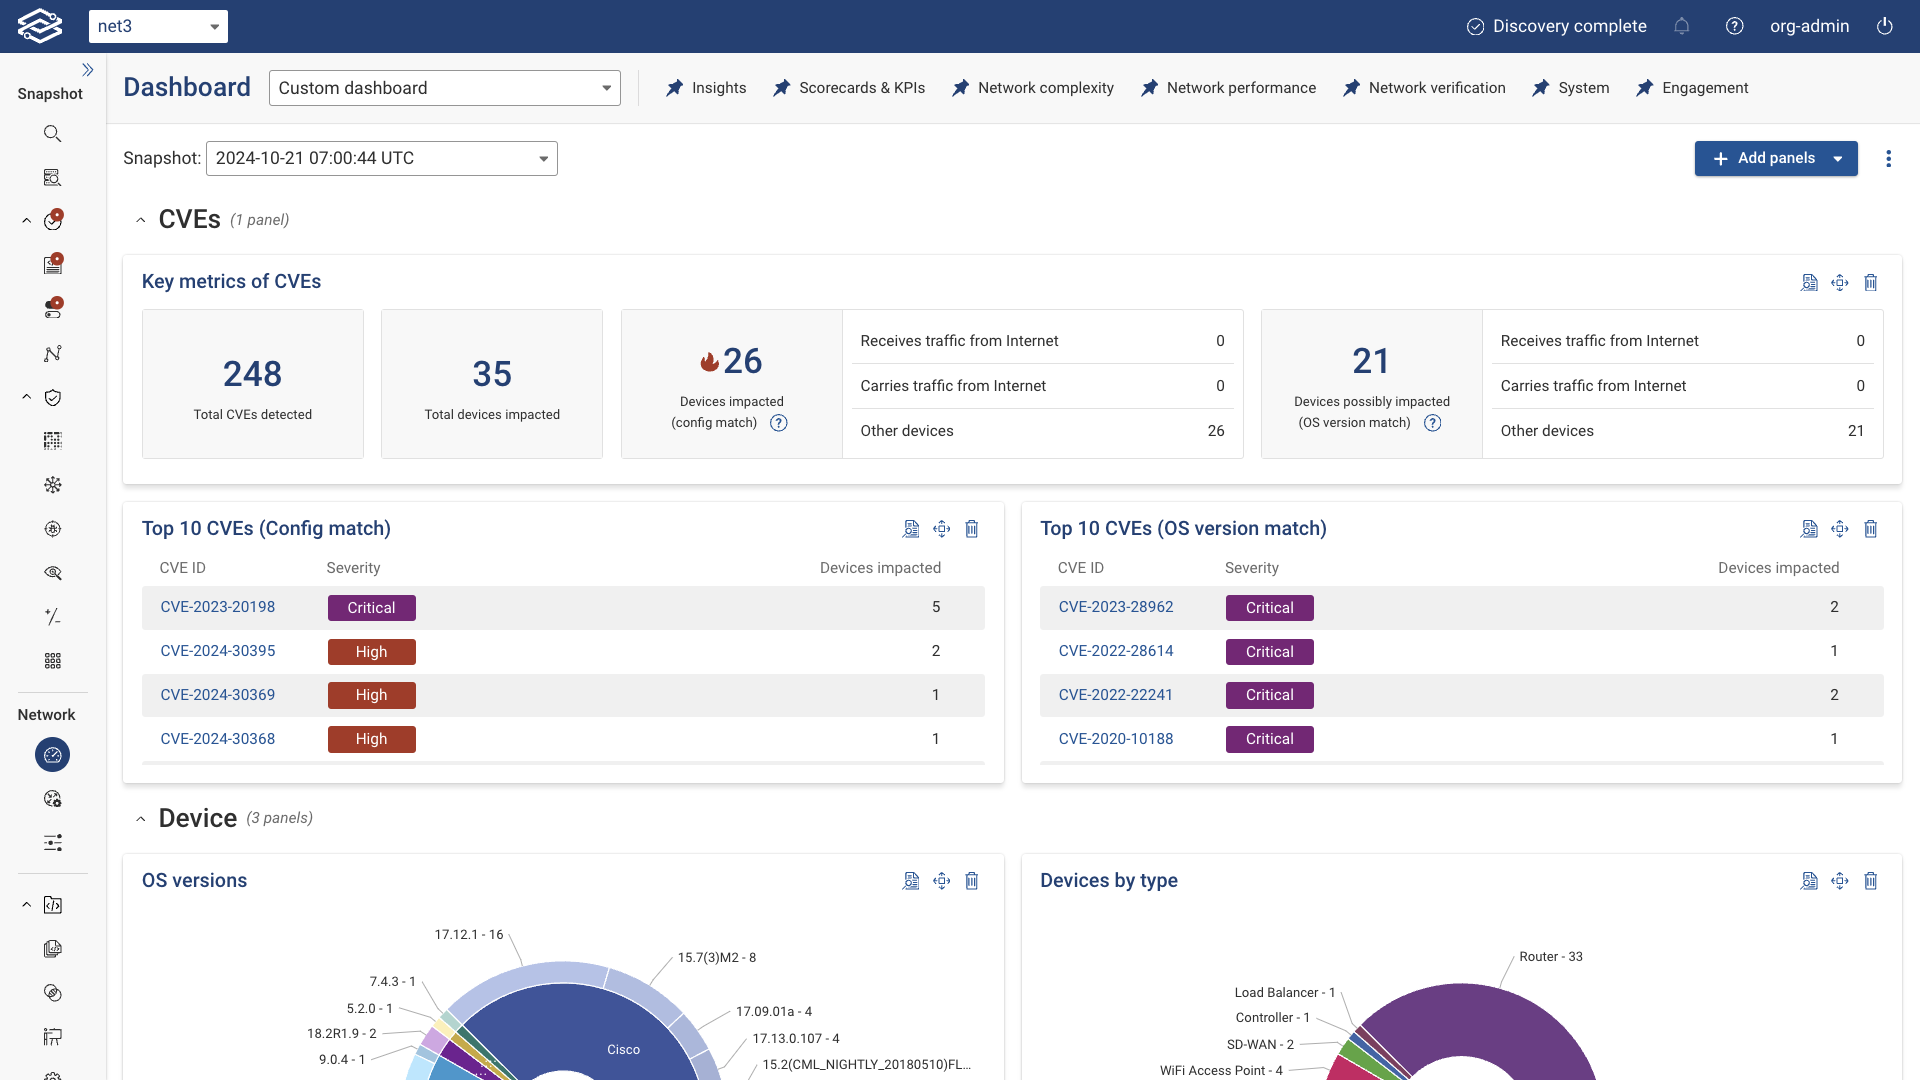
Adding a New Row
To further organize your dashboard, click the Add panels dropdown and select Add a row. You can rename the row by clicking the Edit icon next to the row title.
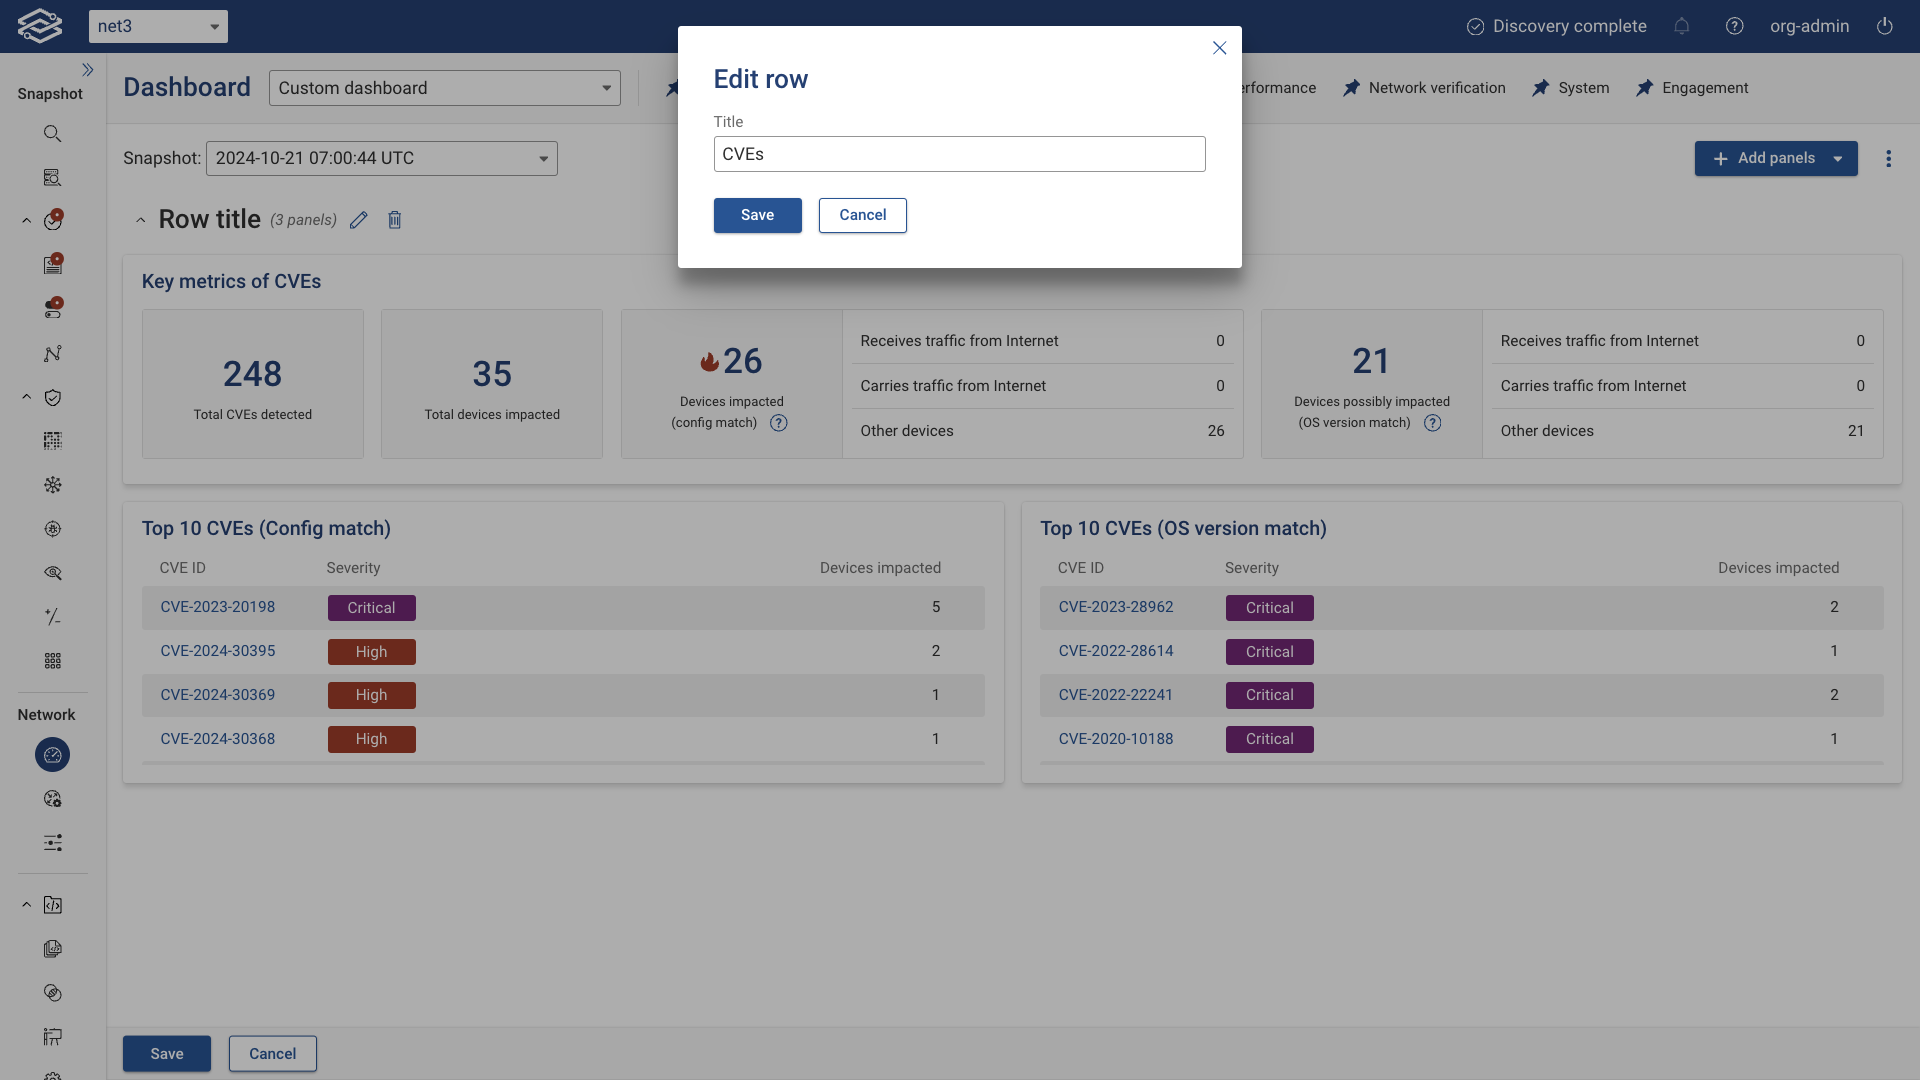
Move panels under the new row to group and organize them as needed.
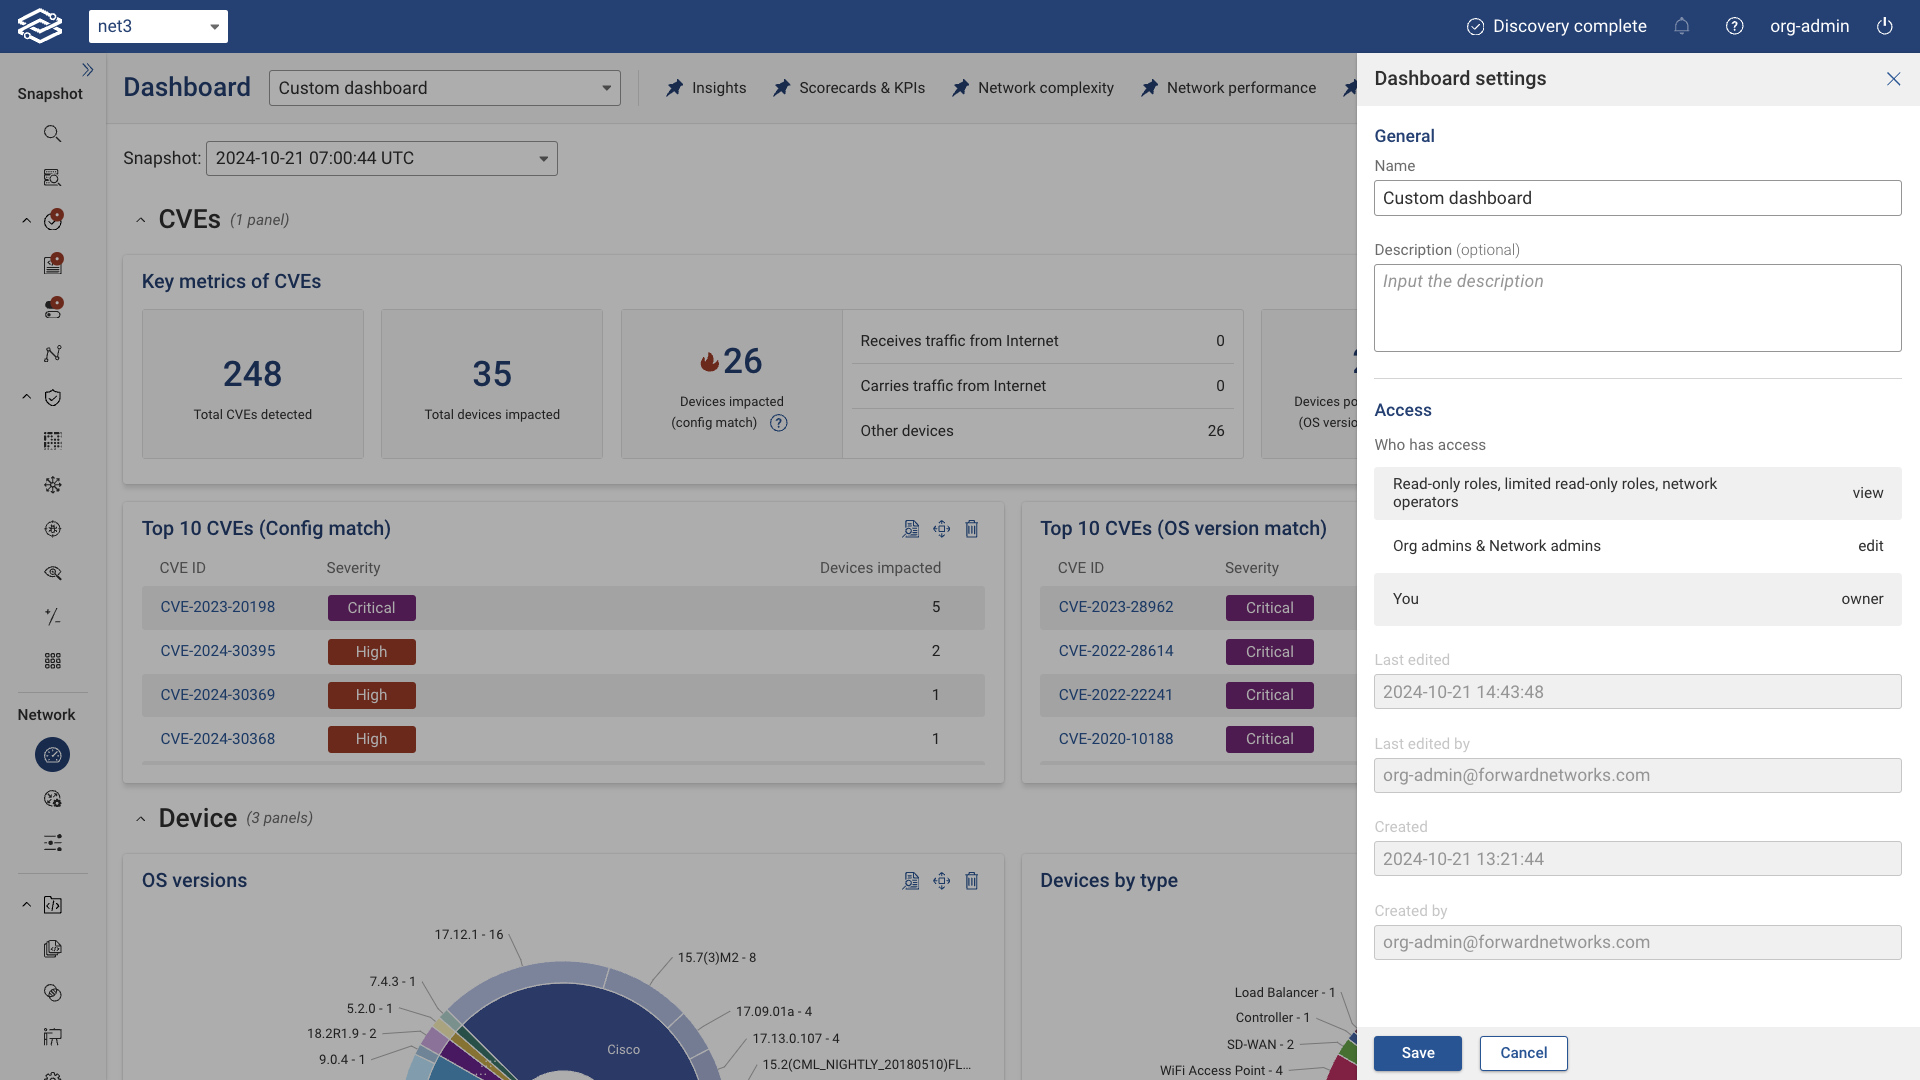
View/Edit Dashboard Settings
To access or edit the dashboard settings, click the Kebab menu (three vertical dots) and select Dashboard settings. Here, you can:
- Edit the dashboard name and description.
- View access details, such as who has permission to view or edit the dashboard.
- See information about when the dashboard was created, who created it, and the last time it was edited.
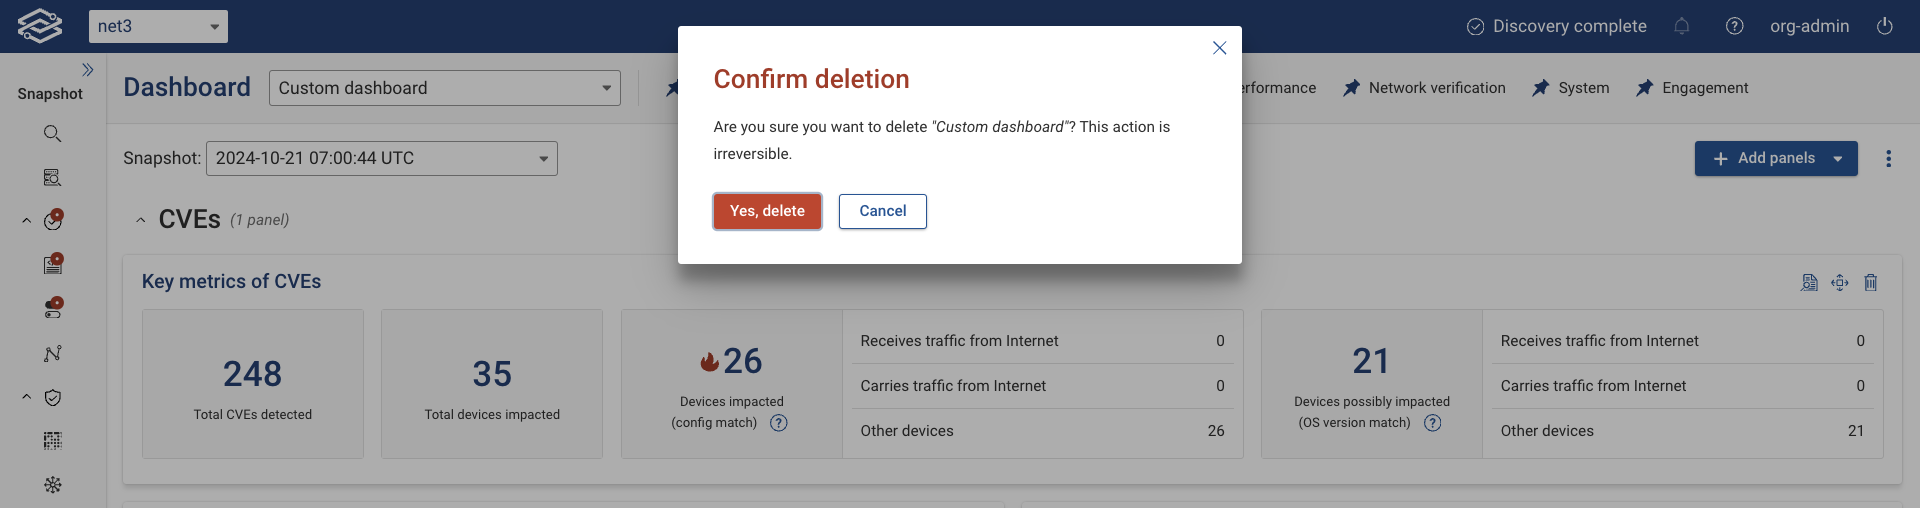
Deleting a Dashboard
To delete a custom dashboard, open the Dashboard Selector dropdown and click the Delete icon next to the dashboard you want to remove.
You can also delete a custom dashboard while viewing it by selecting the Kebab menu and choosing Delete. Note that only user-defined dashboards can be deleted.
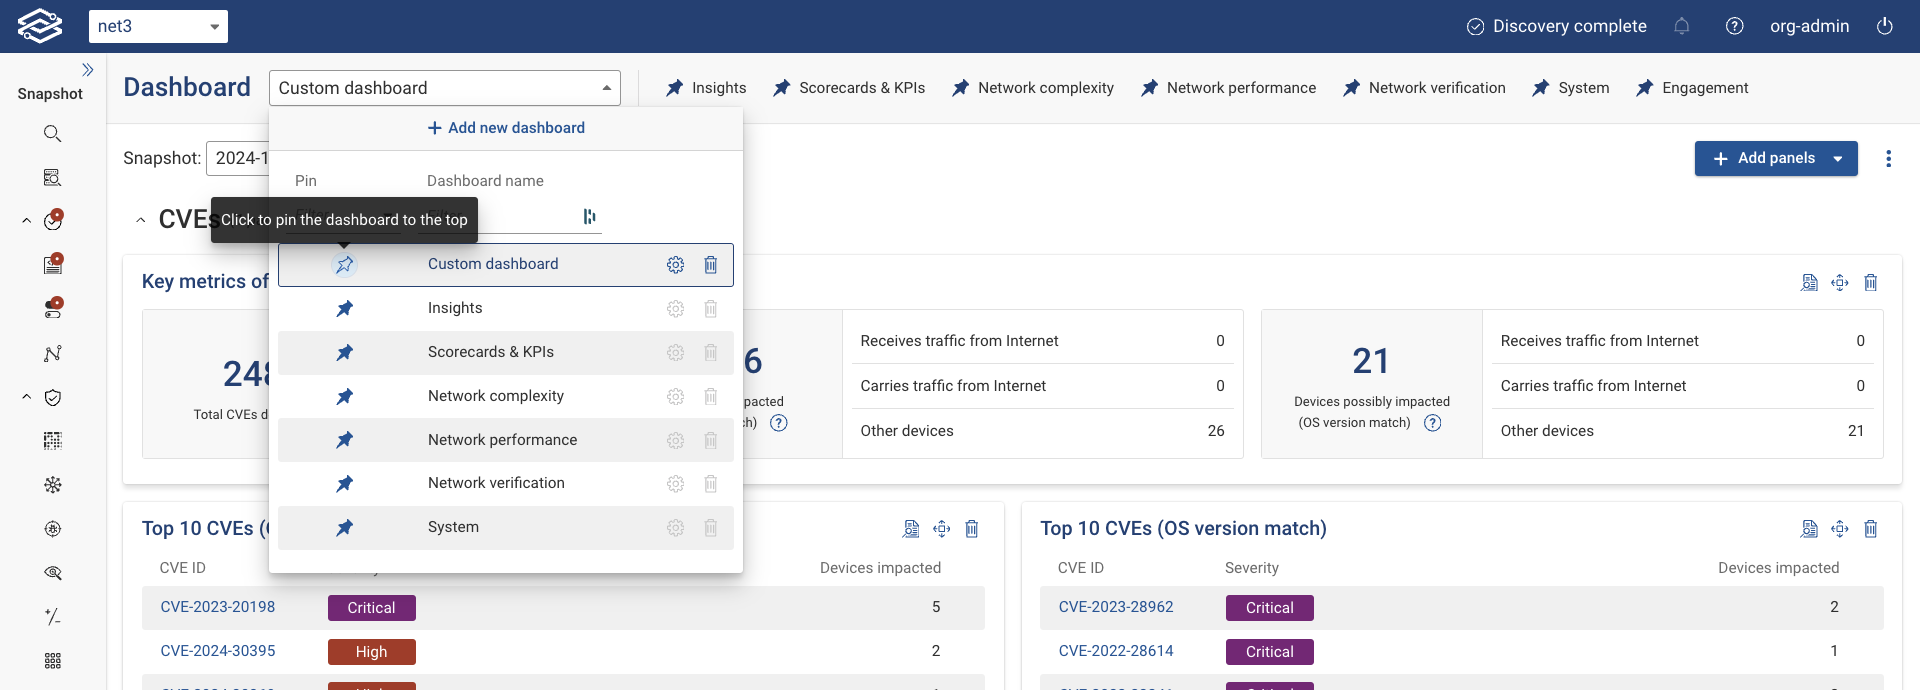
Pinning Dashboards
By default, all Forward-maintained dashboards are pinned to the top of the page. To pin or unpin a dashboard, open the Dashboard Selector and click the pin icon next to each dashboard’s name. Pinned dashboards appear at the top of the page for easy access.
Forward-maintained Dashboards
Insights Dashboard
The Insights dashboard provides a comprehensive overview of the network's operational health and security posture, enabling users to swiftly identify issues, monitor performance trends, and make informed decisions to enhance network security and efficiency. Users can select different Snapshots of their network to view specific datasets within the dashboard, providing a flexible examination of network states at various points in time.
Vulnerabilities and Verifications
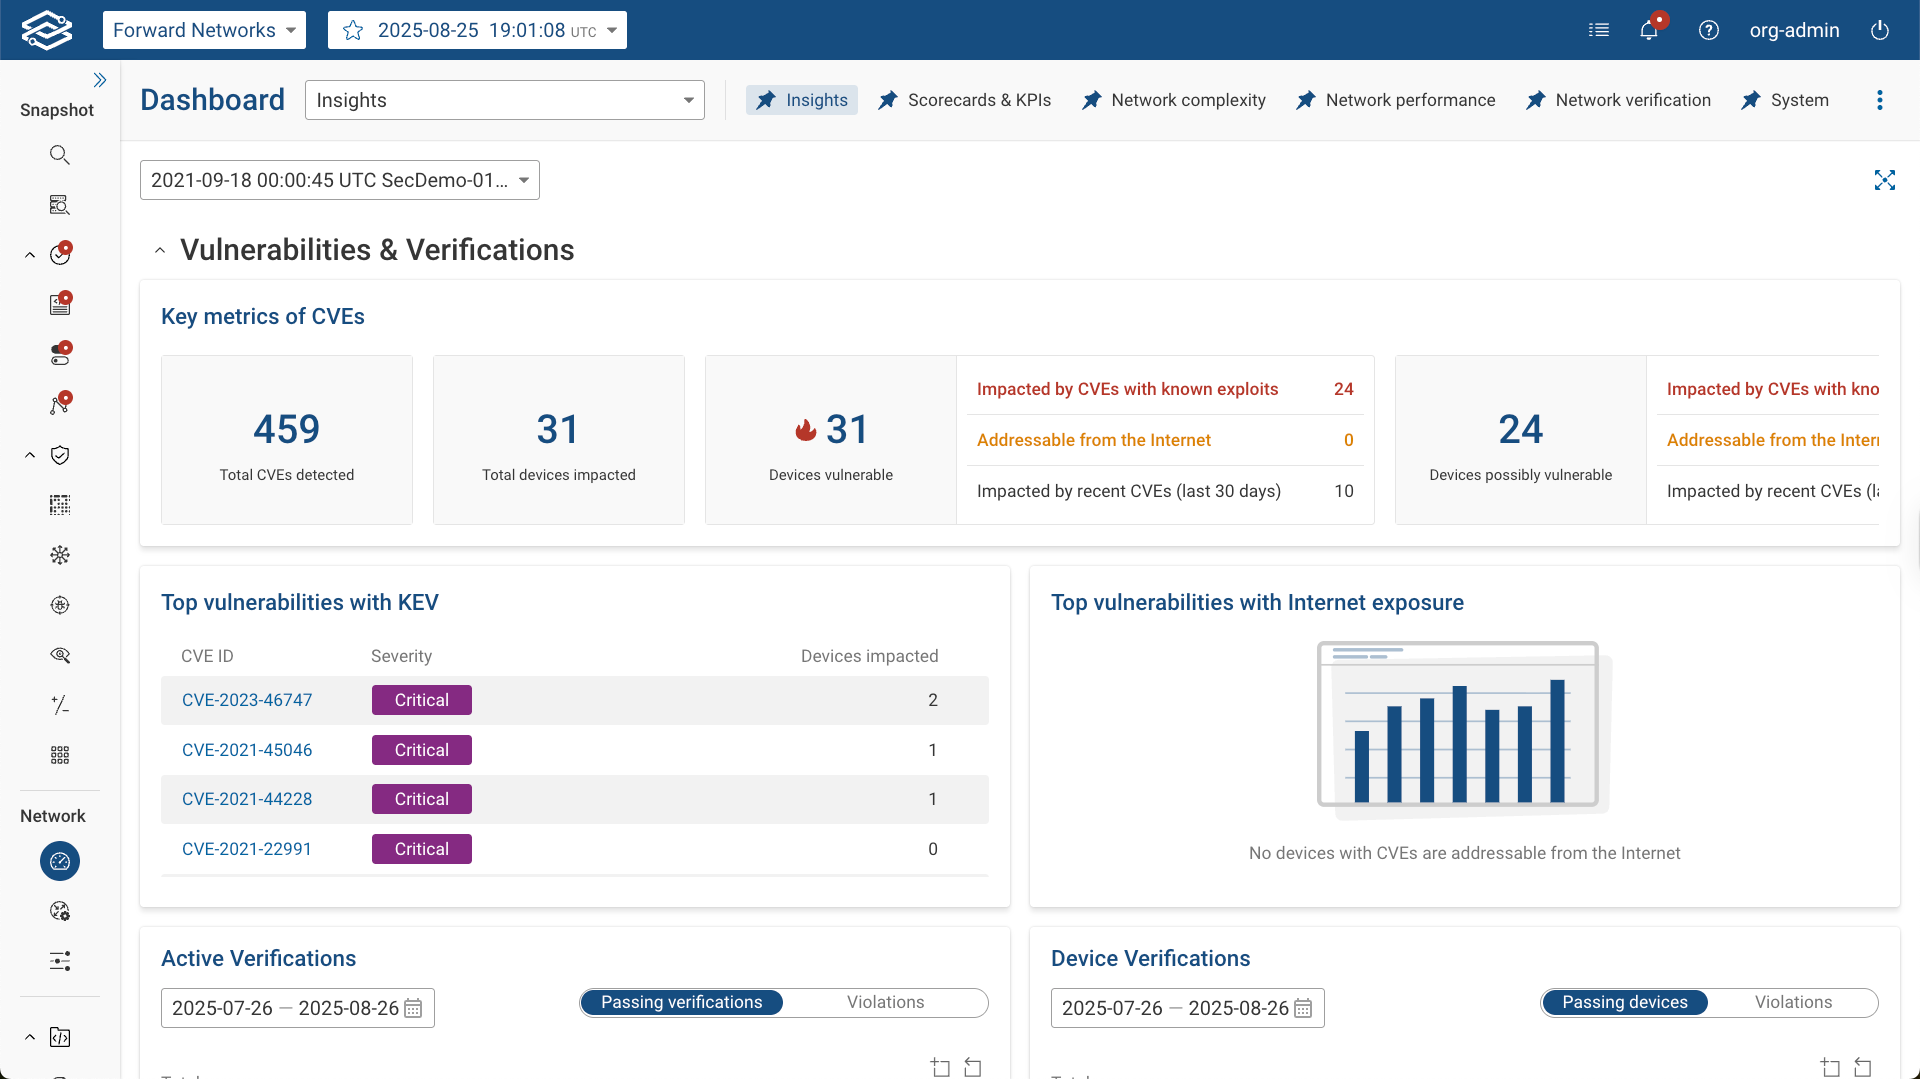
The Vulnerabilities and Verifications section highlights network security by providing Common Vulnerabilities and Exposures (CVEs) metrics and verification results.
Key Metrics of CVEs displays numerical counts for:
- Total CVEs detected: Overall number of CVEs identified in the current snapshot.
- Total devices impacted: Number of devices affected by at least one detected CVE.
- Devices vulnerable: Number of devices confirmed as vulnerable, broken down by:
- Impacted by CVEs with known exploits: Devices with CVEs that have a documented exploit published by CISA or a vendor.
- Addressable from the Internet: Devices with vulnerabilities that are reachable from the Internet.
- Impacted by recent CVEs (last 30 days): Devices affected by vulnerabilities published within the last 30 days.
- Devices potentially vulnerable: Number of devices that may be vulnerable, broken down by:
- Impacted by CVEs with known exploits: Devices with CVEs that have documented exploits but require further configuration checks to confirm.
- Addressable from the Internet: Devices with possible vulnerabilities that are reachable from the Internet.
- Impacted by recent CVEs (last 30 days): Devices potentially affected by CVEs published within the last 30 days.
Additional views include:
- Top vulnerabilities with KEV: Highlights CVEs with known exploits.
- Top vulnerabilities with Internet Exposure: Lists CVEs impacting devices that are Internet addressable.
- Active Verifications: A tabbed view showing the total number of passing verifications and violations.
- Device Verifications: A tabbed view showing the total number of devices passing verification checks and those with violations.
Scorecards and KPIs
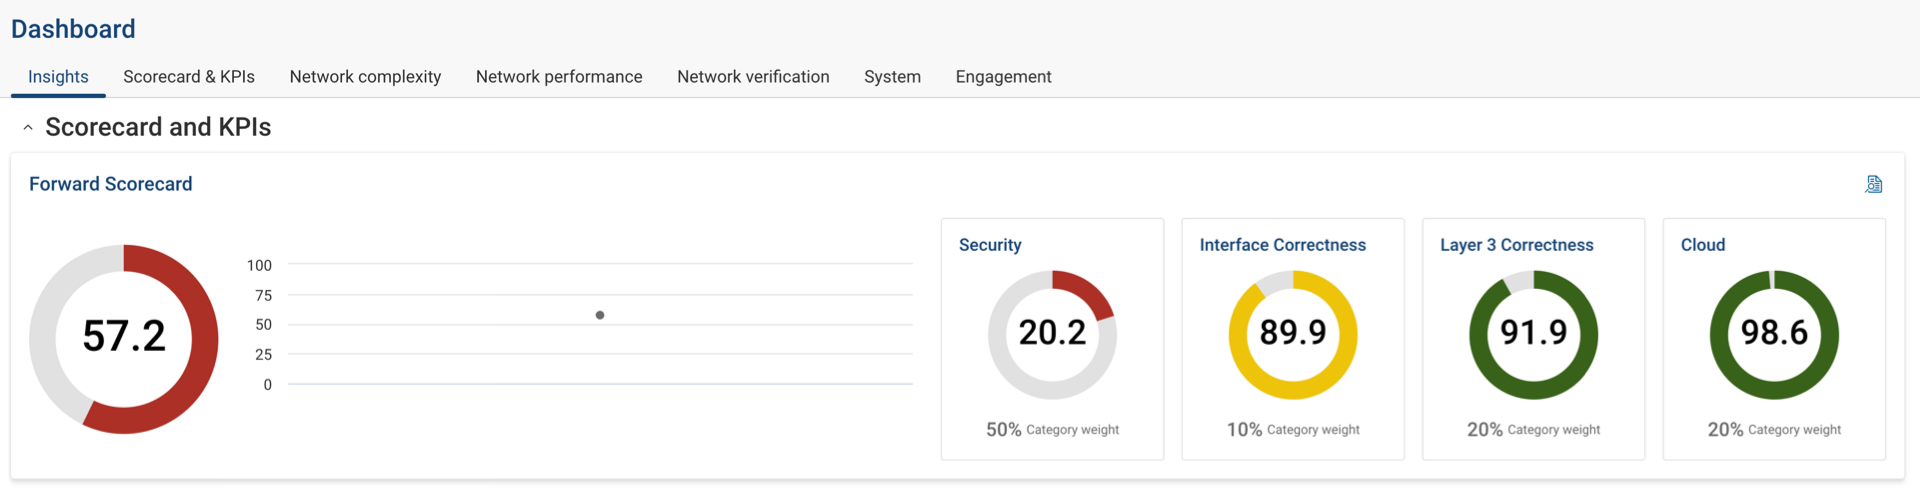
This section displays scorecard metrics directly from the Scorecards and KPIs dashboard, providing users to view the network's operational efficiency and adherence to set KPIs.
Lay of the land
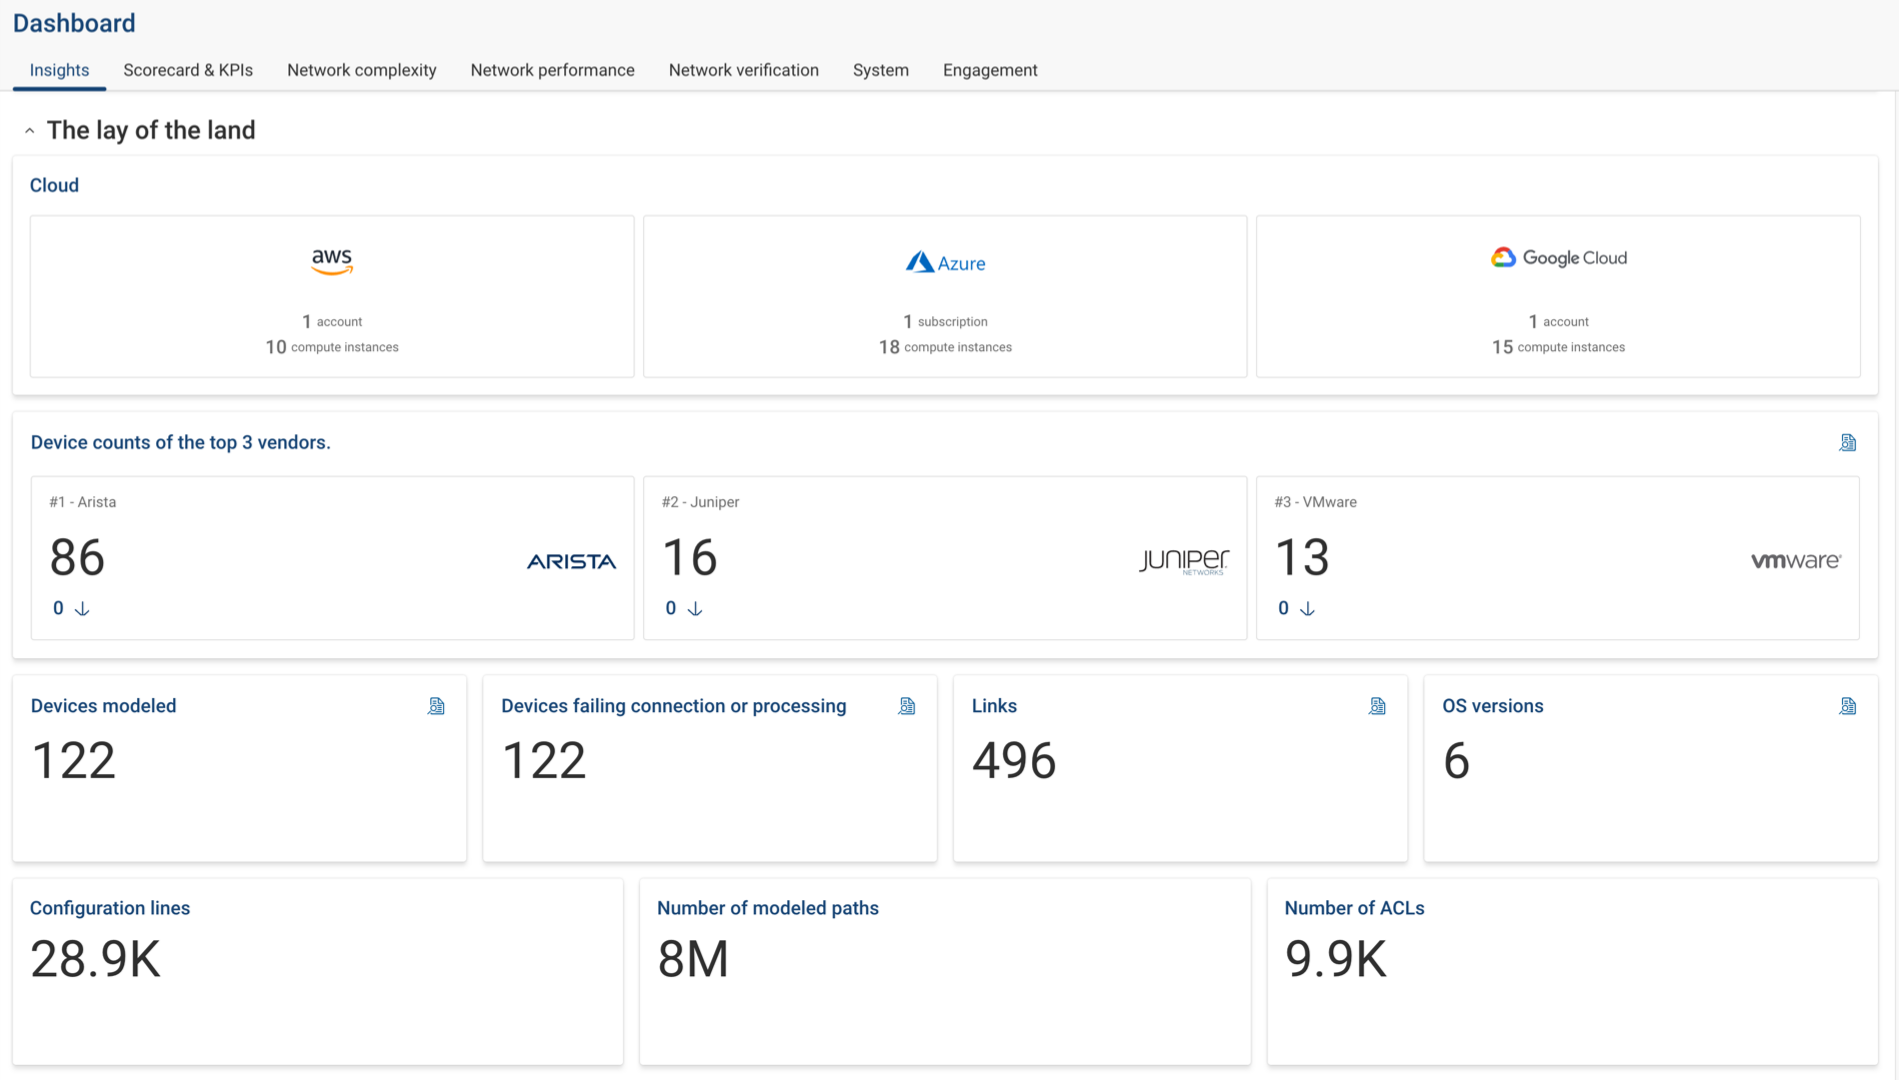
This section offers a broad overview of the network's infrastructure, including details regarding the number of cloud accounts and compute instances, device counts by top vendors, connection failures, and essential metrics such as links, OS versions, configuration lines, modeled paths, and ACLs.
Scorecard and KPIs dashboard
The Scorecard and KPIs dashboard provides greater insight into the overall quality and performance of a network. The dashboard is located under the scorecard and KPIs tab of the dashboard page.
Navigating the scorecard and KPIs dashboard
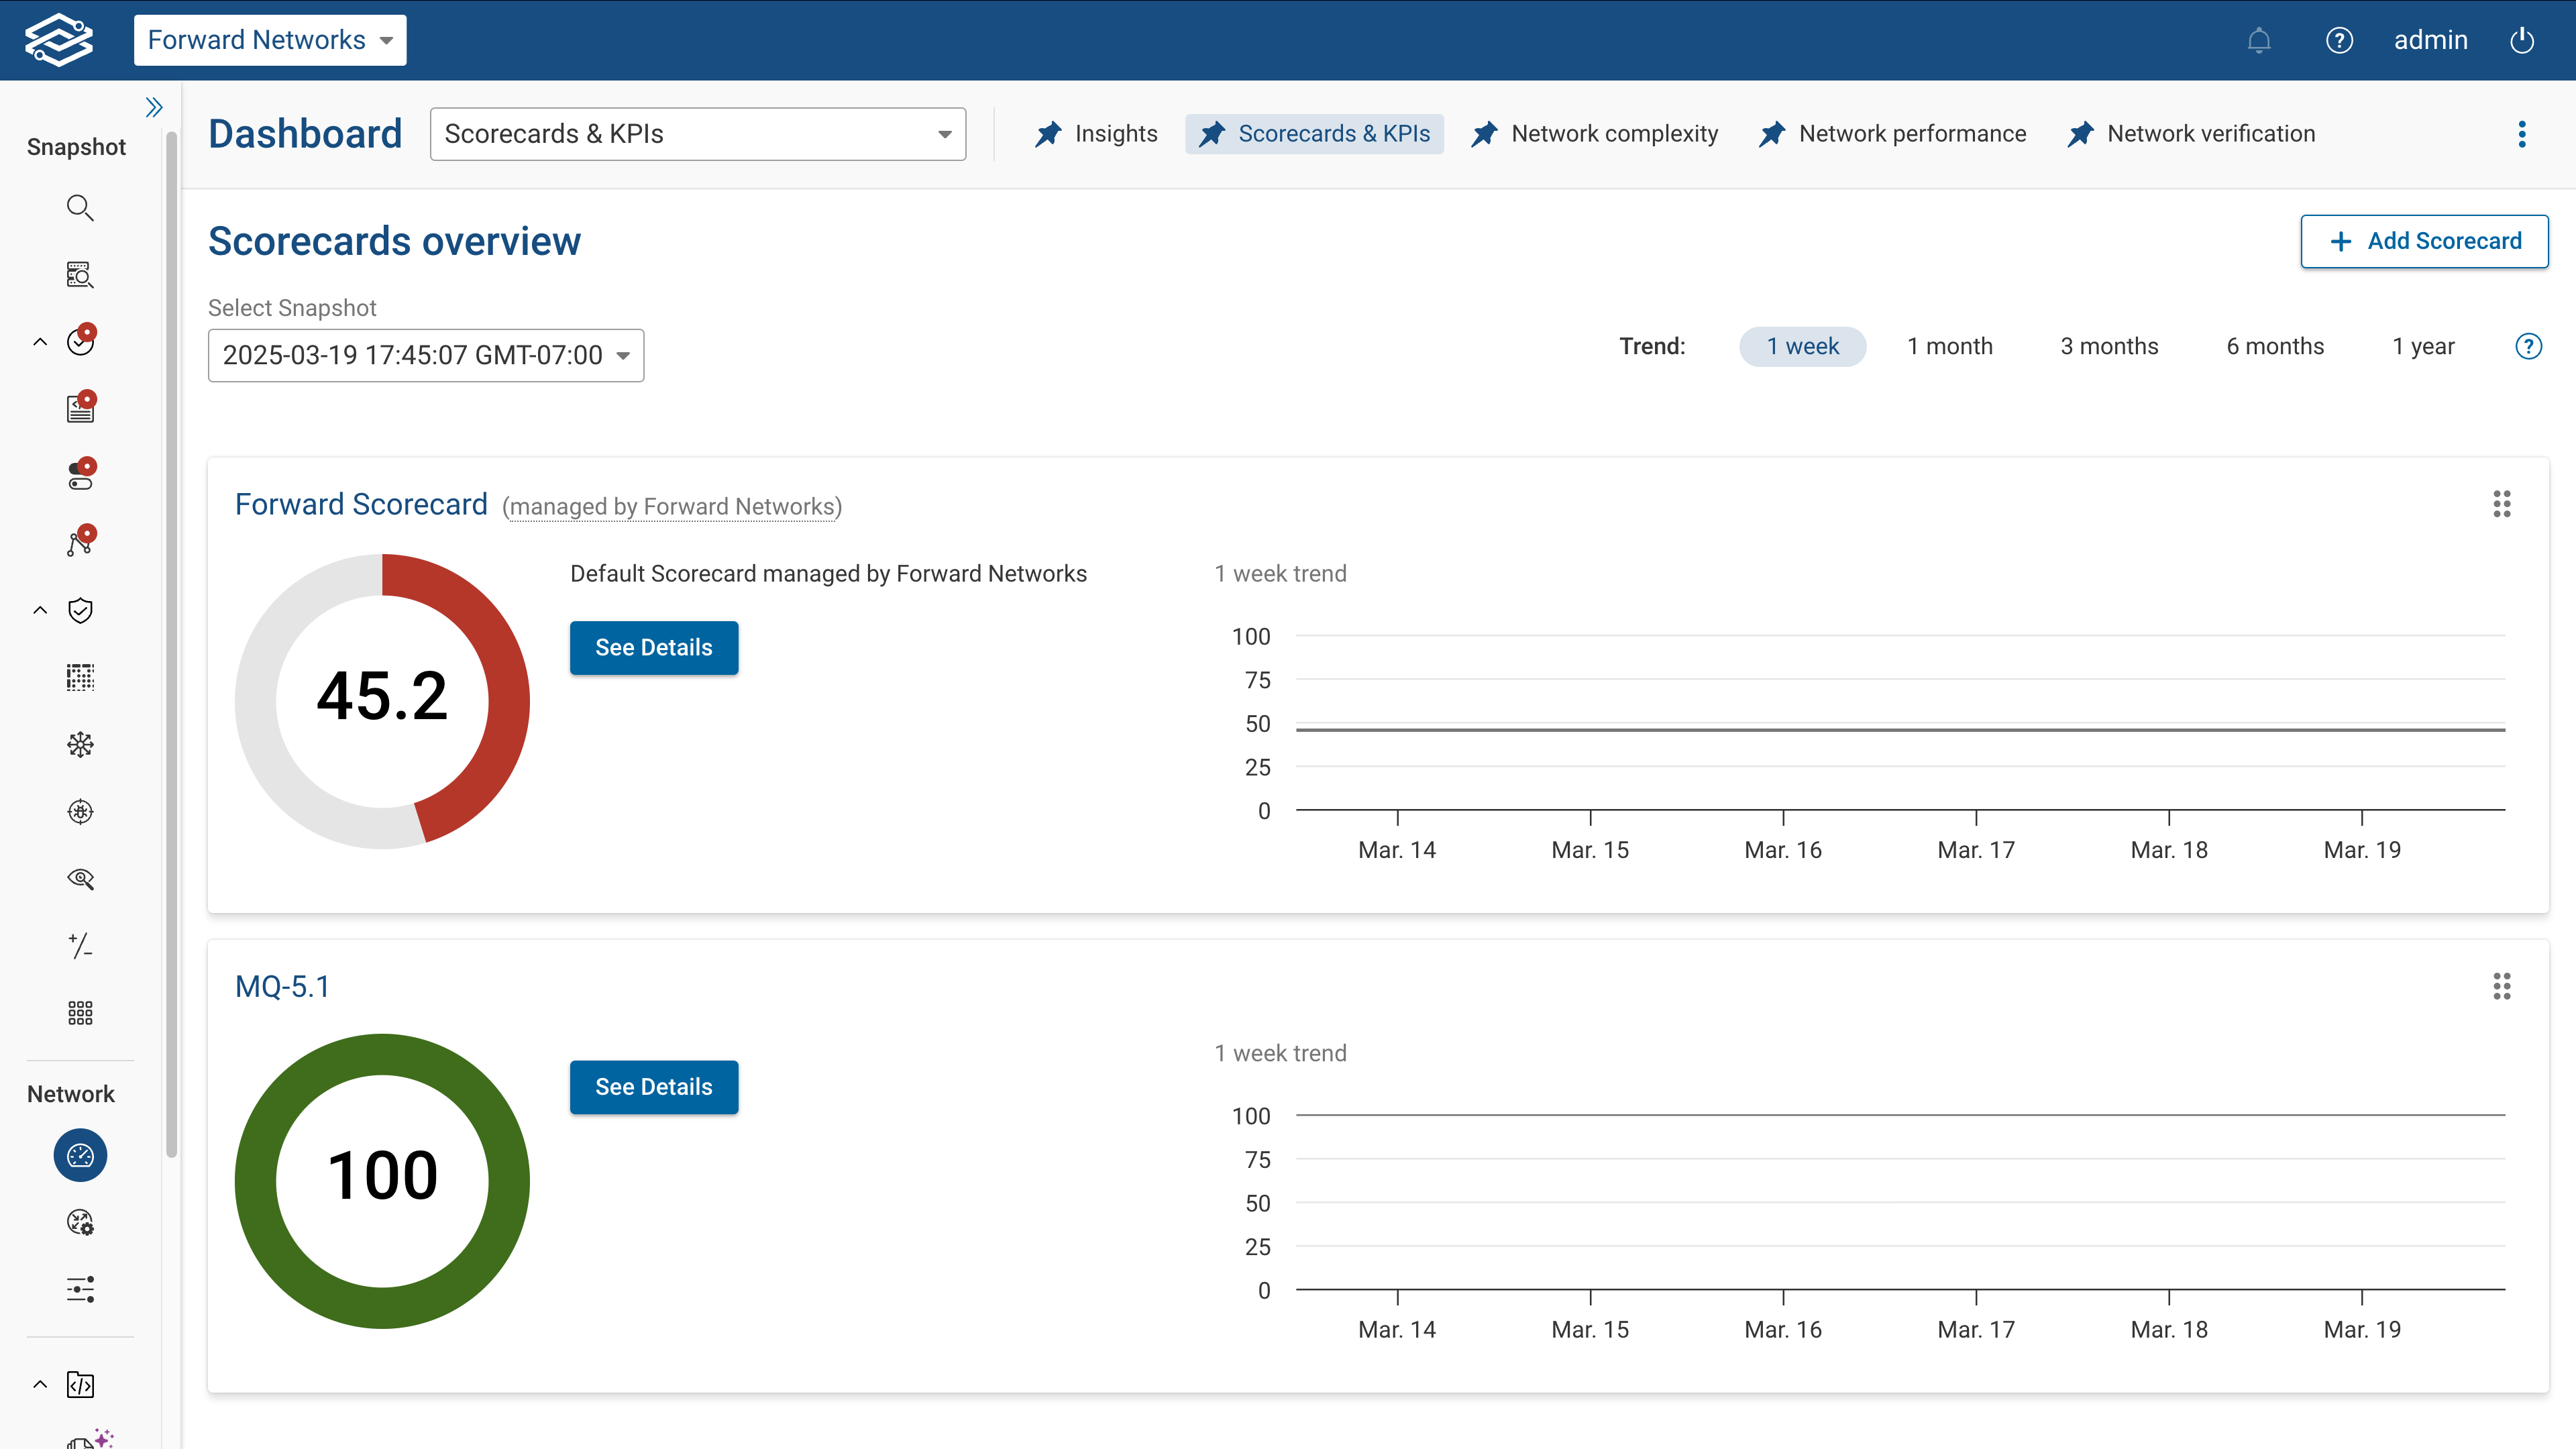
Within the scorecards overview section lists all assigned scorecards. Each scorecard provides its total score and historical trend of a selected snapshot.
A scorecard is a container of Forward Verification Checks grouped into KPI categories. The total score of a scorecard is the combined weighted score of each KPI category assigned to it.
Specific snapshots can be selected within the Select Snapshot drop-down menu. Historical trends can be changed by choosing different time intervals in the trends section.
By default, the Forward Scorecard is included with the scorecard and KPIs dashboard. The Forward Scorecard is a predefined scorecard, managed by Forward Networks, that cannot be modified but can be deleted.
Scorecard detail page
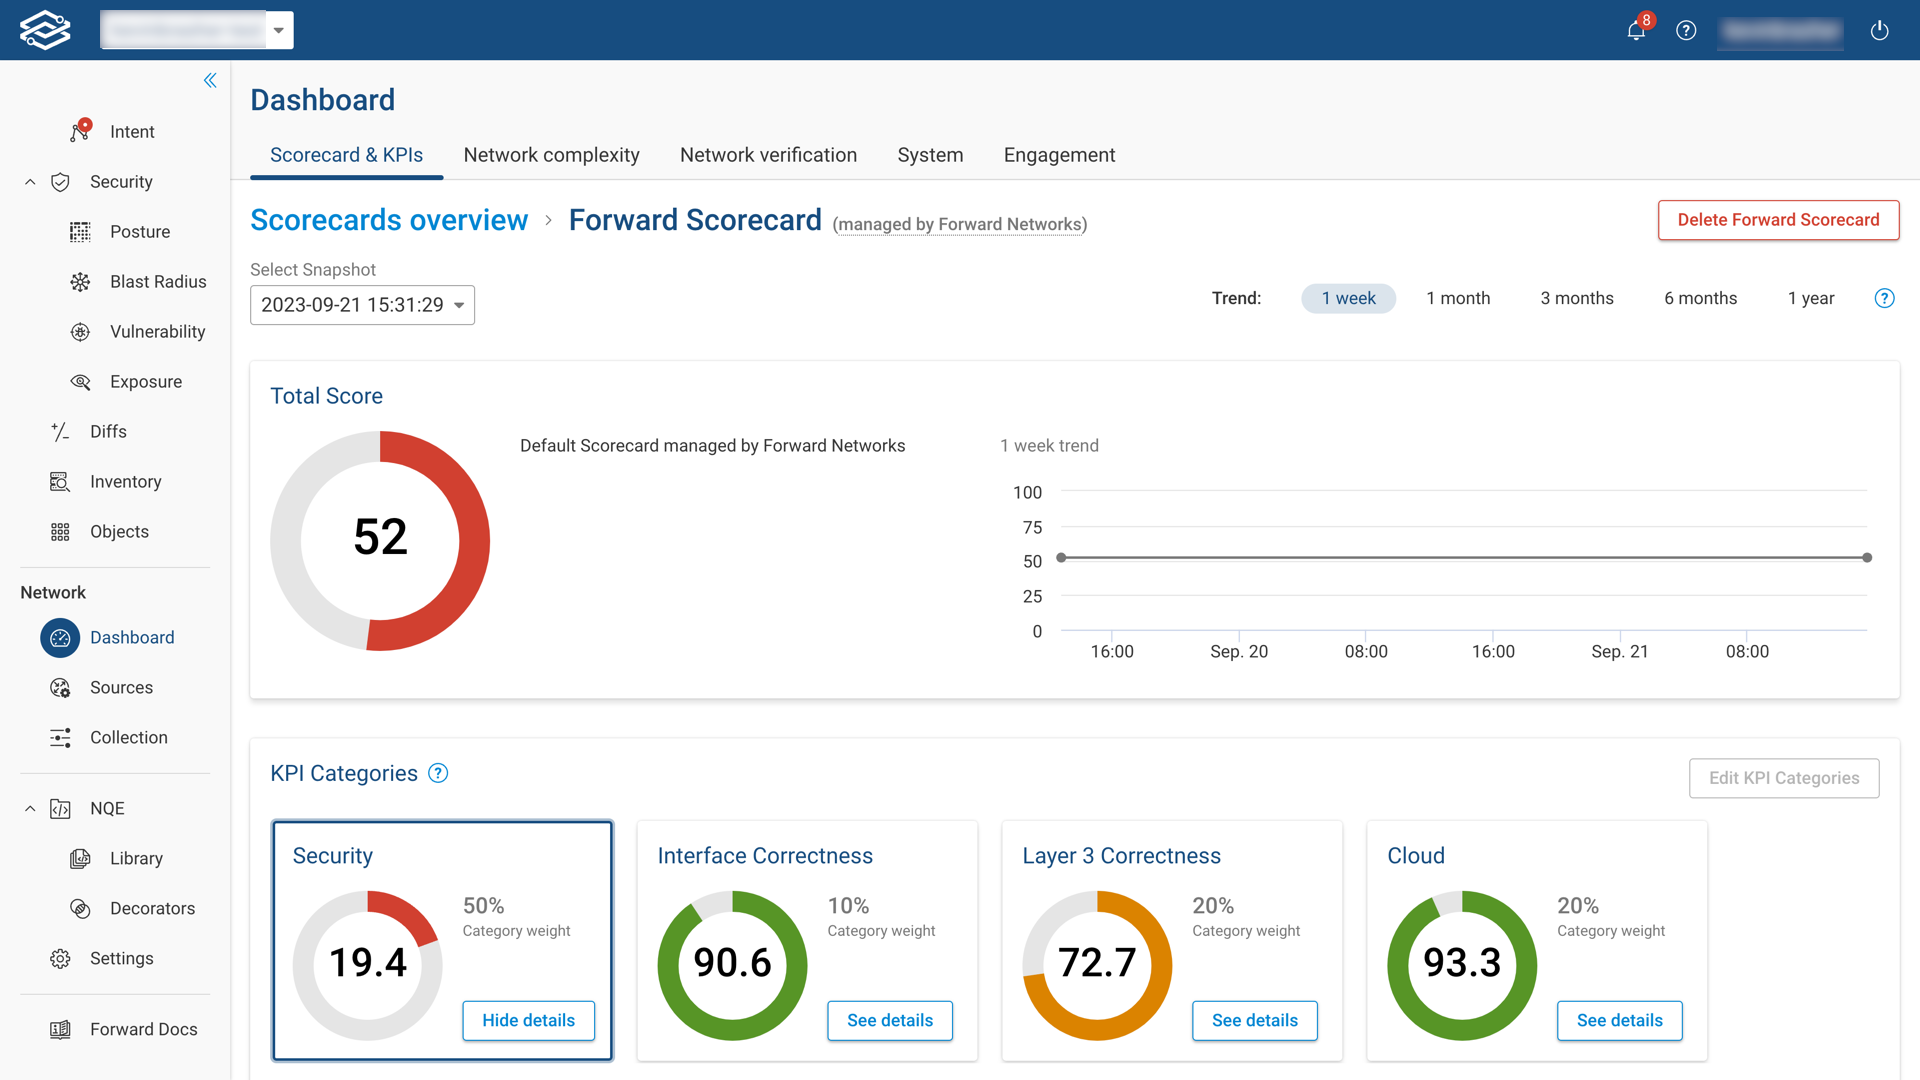
To access a comprehensive breakdown of a specific scorecard, simply click See Details located next to the total score of that scorecard.
Within the scorecard's detail page, you will find the total score for that scorecard. The total score is the cumulative-weighted value of all the KPI categories assigned to that scorecard.
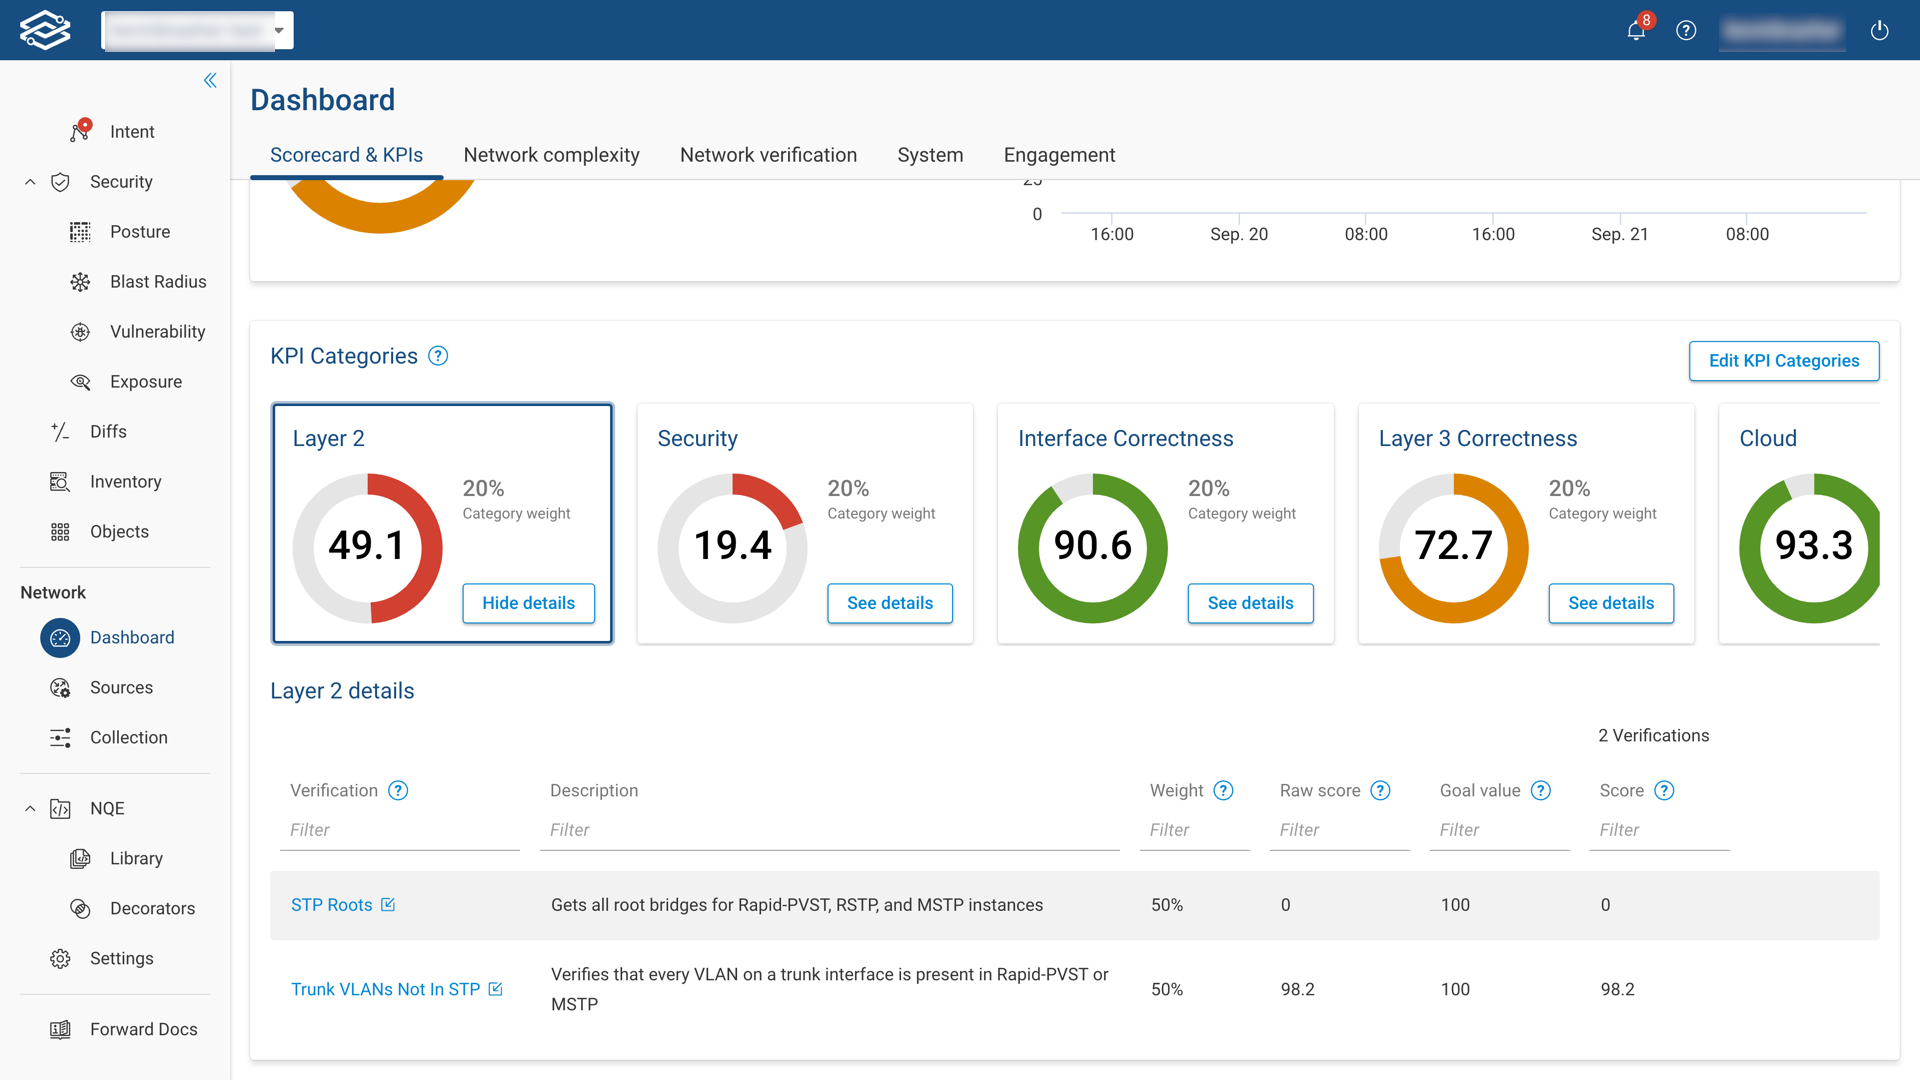
In the KPI Category section, you will find a list of each KPI category associated with the scorecard. Each KPI category displays both a total score and the weighted value specific to that category.
To explore further, selecting See Details for a specific KPI category will provide you with a list of its associated verification checks. For each verification, you'll find essential information, including weight, raw score, goal value, and current score.
Adding a scorecard
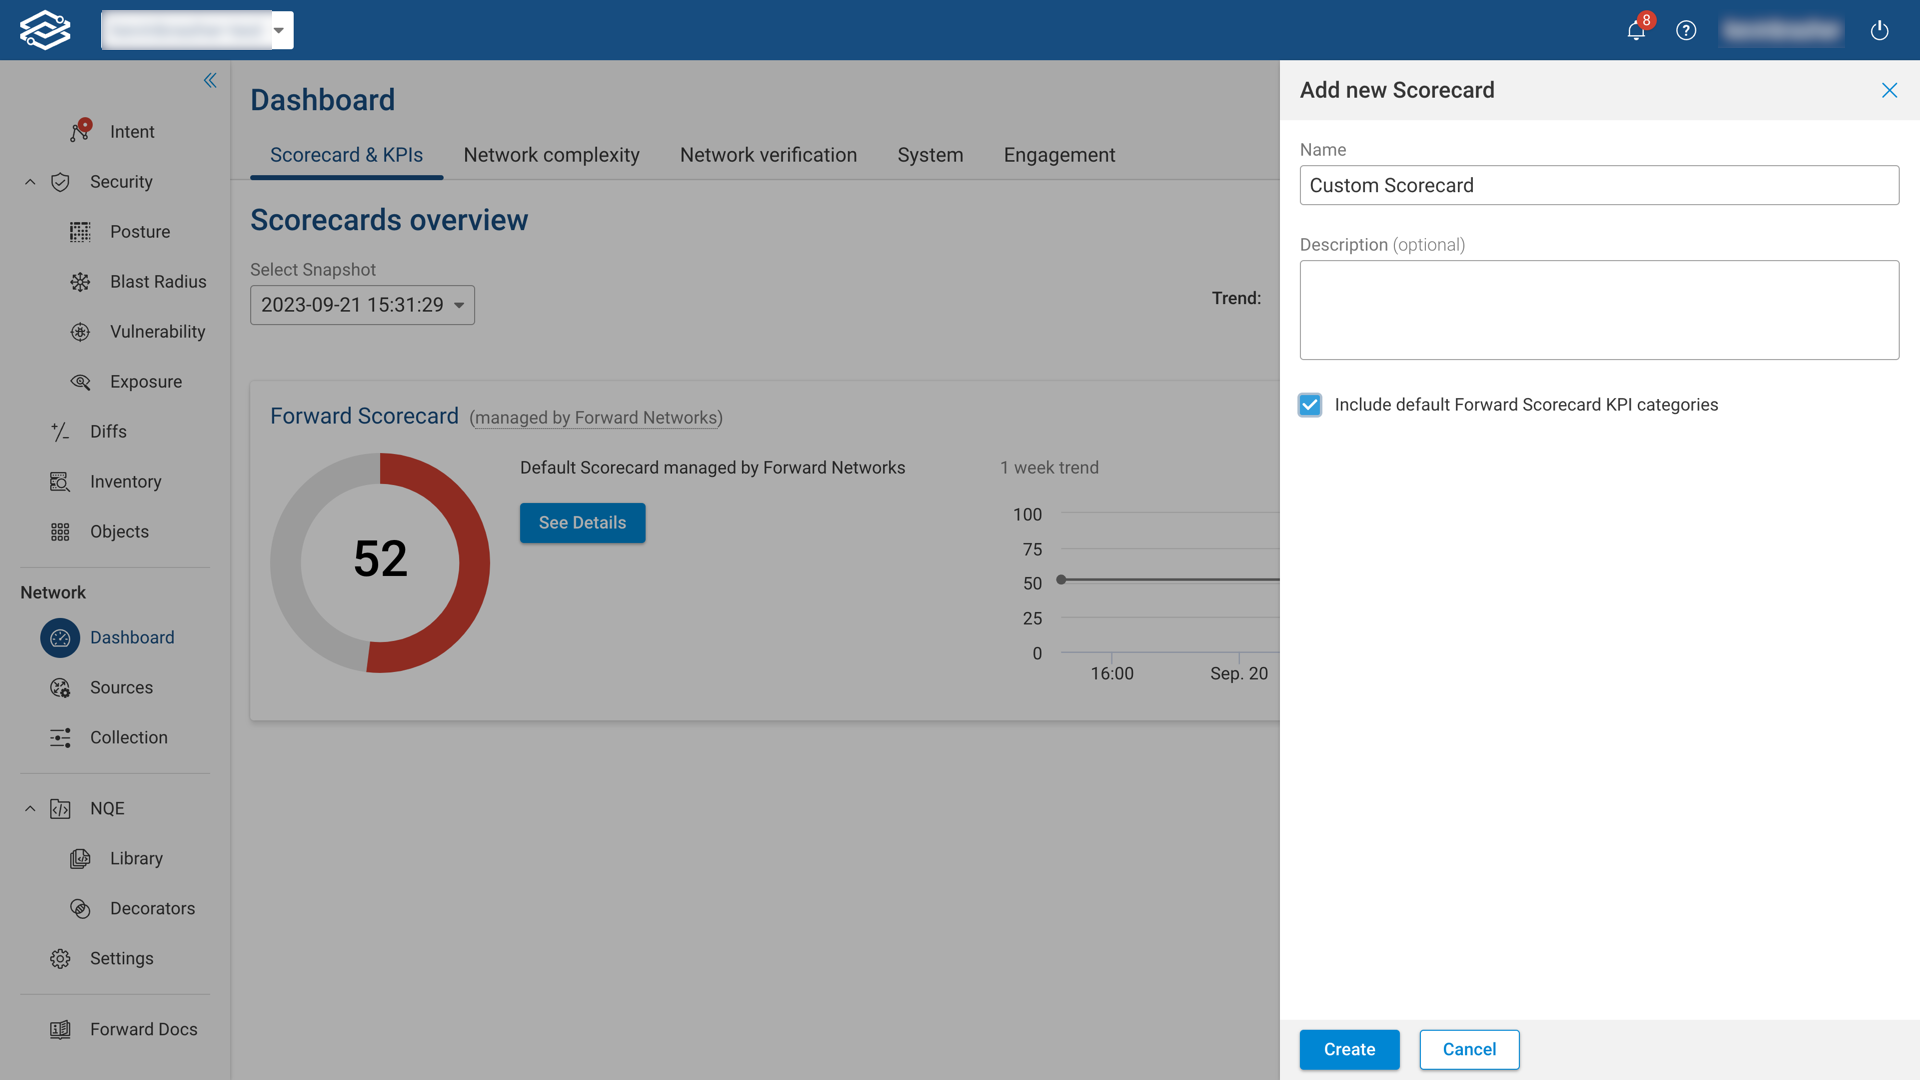
To add a new scorecard, select Add Scorecard from the Scorecard KPI dashboard.
Fill in a name for your scorecard, and brief description in the designated field.
Select Create to finish the process.
Select Include default Forward Scorecard KPI categories to include a copy of the KPI categories used for the Forward Scorecard. Leaving this unselected will create an empty scorecard.
Editing and deleting a scorecard
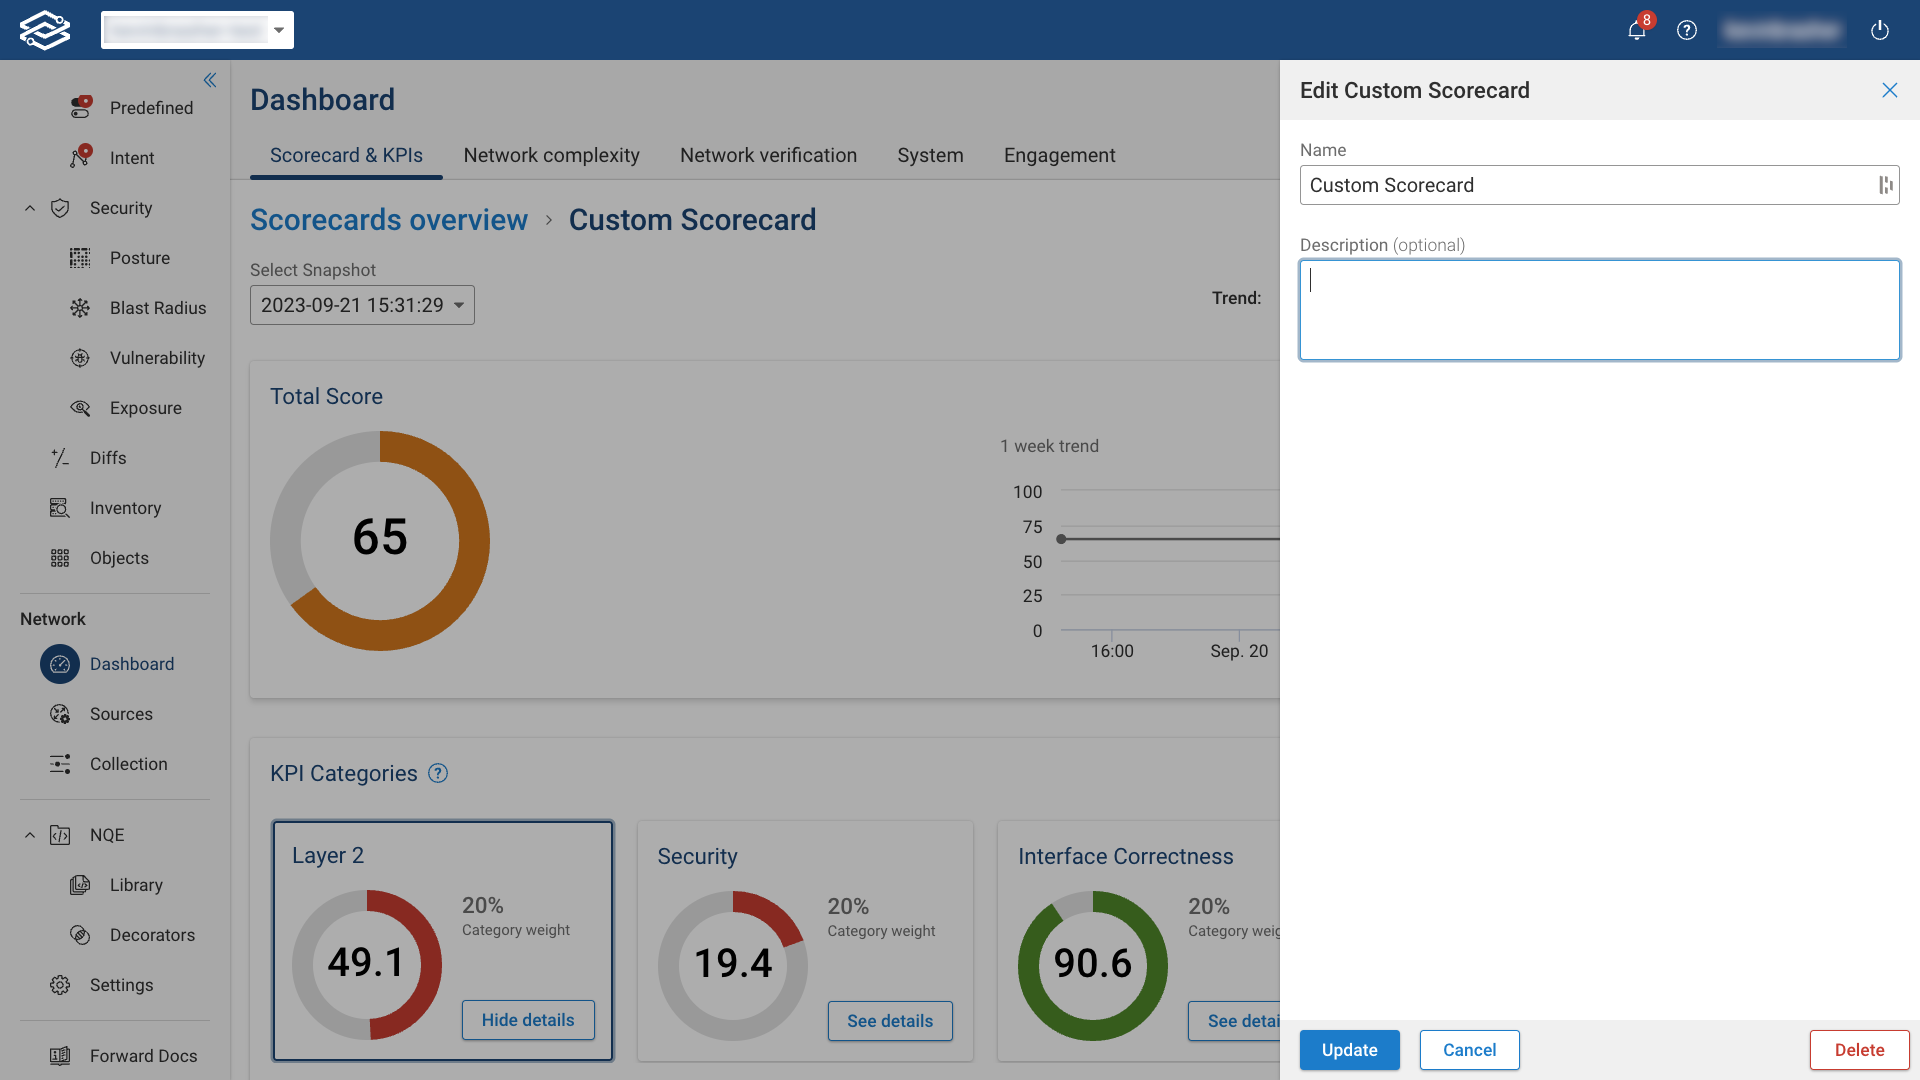
To edit a scorecard, use the Edit Scorecard option located within the scorecard's detail page. This allows you to adjust the scorecard's name and description.
To remove a scorecard from the dashboard, simply select the delete option.
Editing a KPI category
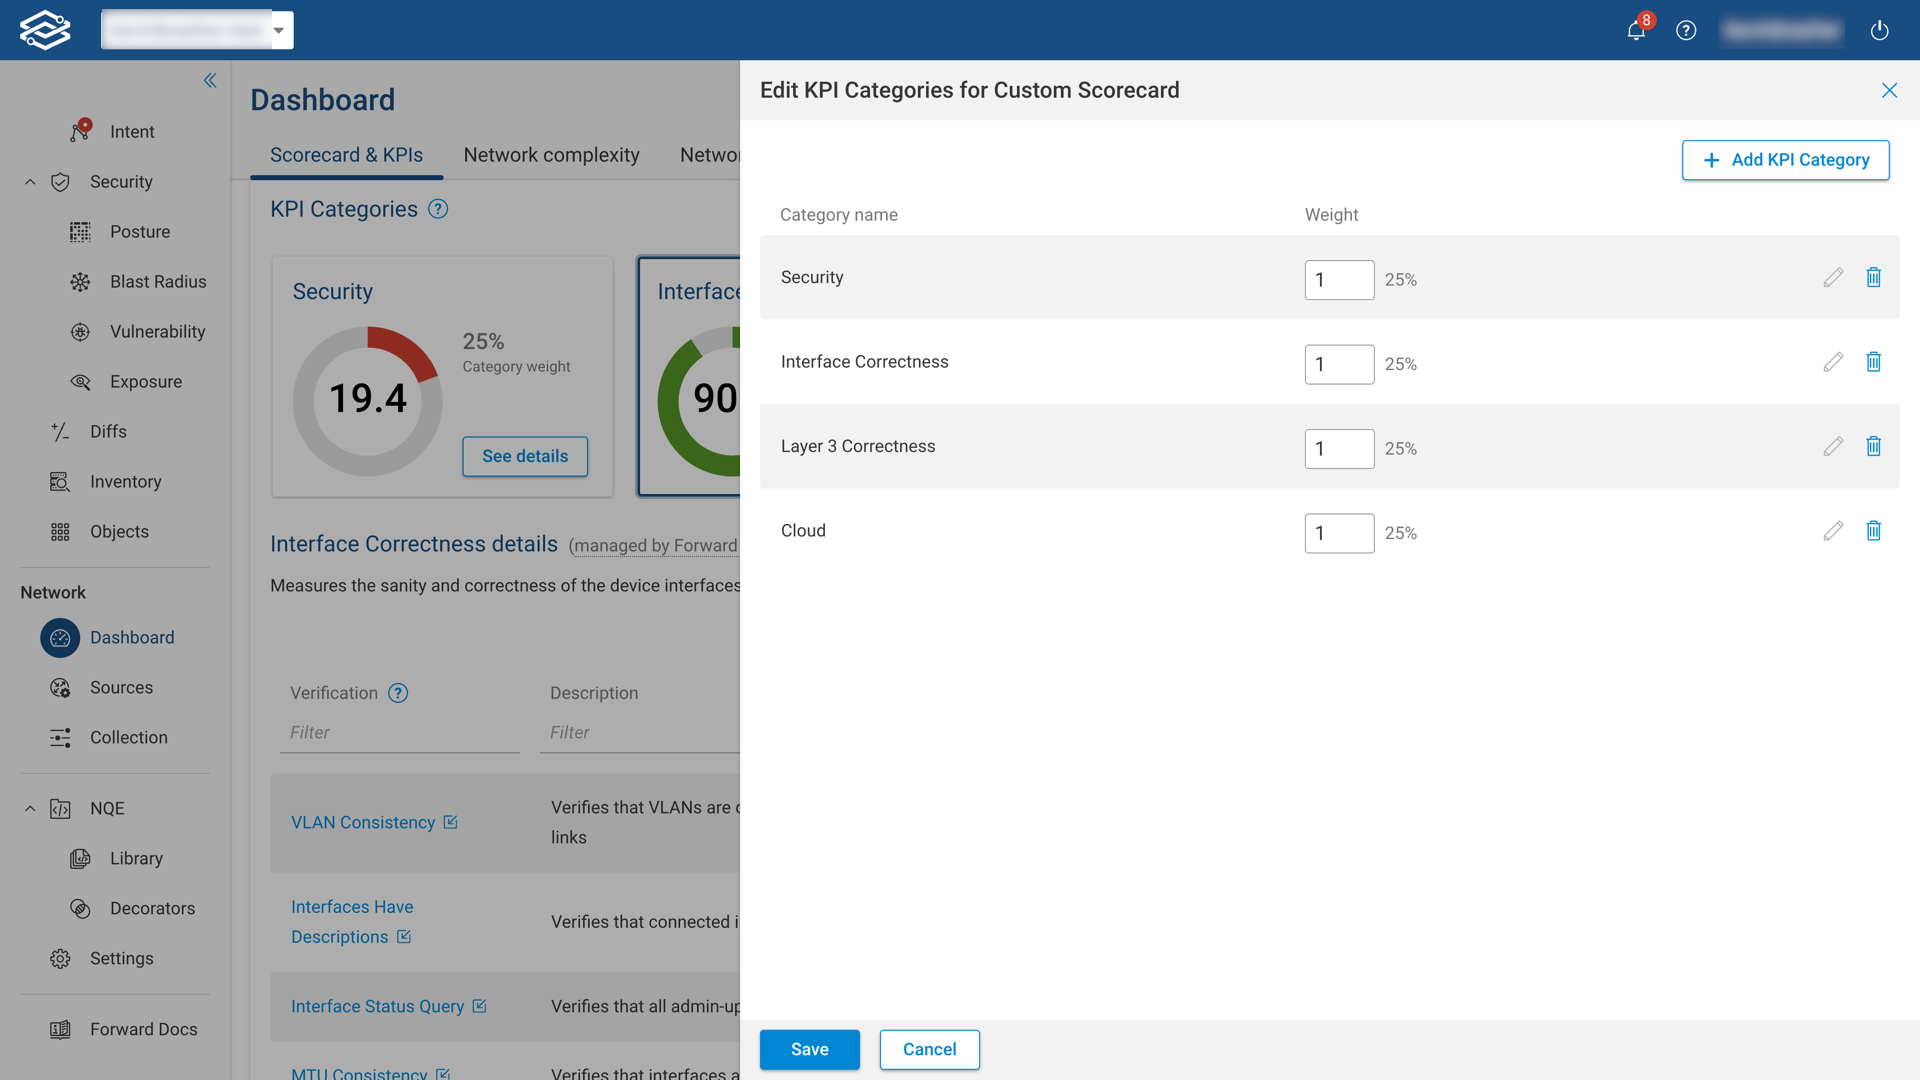
To make changes to a KPI category, go to the KPI category section of the scorecard's detail page and choose Edit KPI categories.
A list of assigned KPI categories along with their weighted scores will be displayed.
To edit a KPI category, select the edit icon, allowing you to modify its name, description, and weighted score.
To remove a KPI category from a scorecard, select the delete icon. This will remove the KPI category from the scorecard, while still making it available within the existing KPI category list for future use.
To add new or existing KPI categories, select Add KPI Category for additional steps.
Adding a KPI category
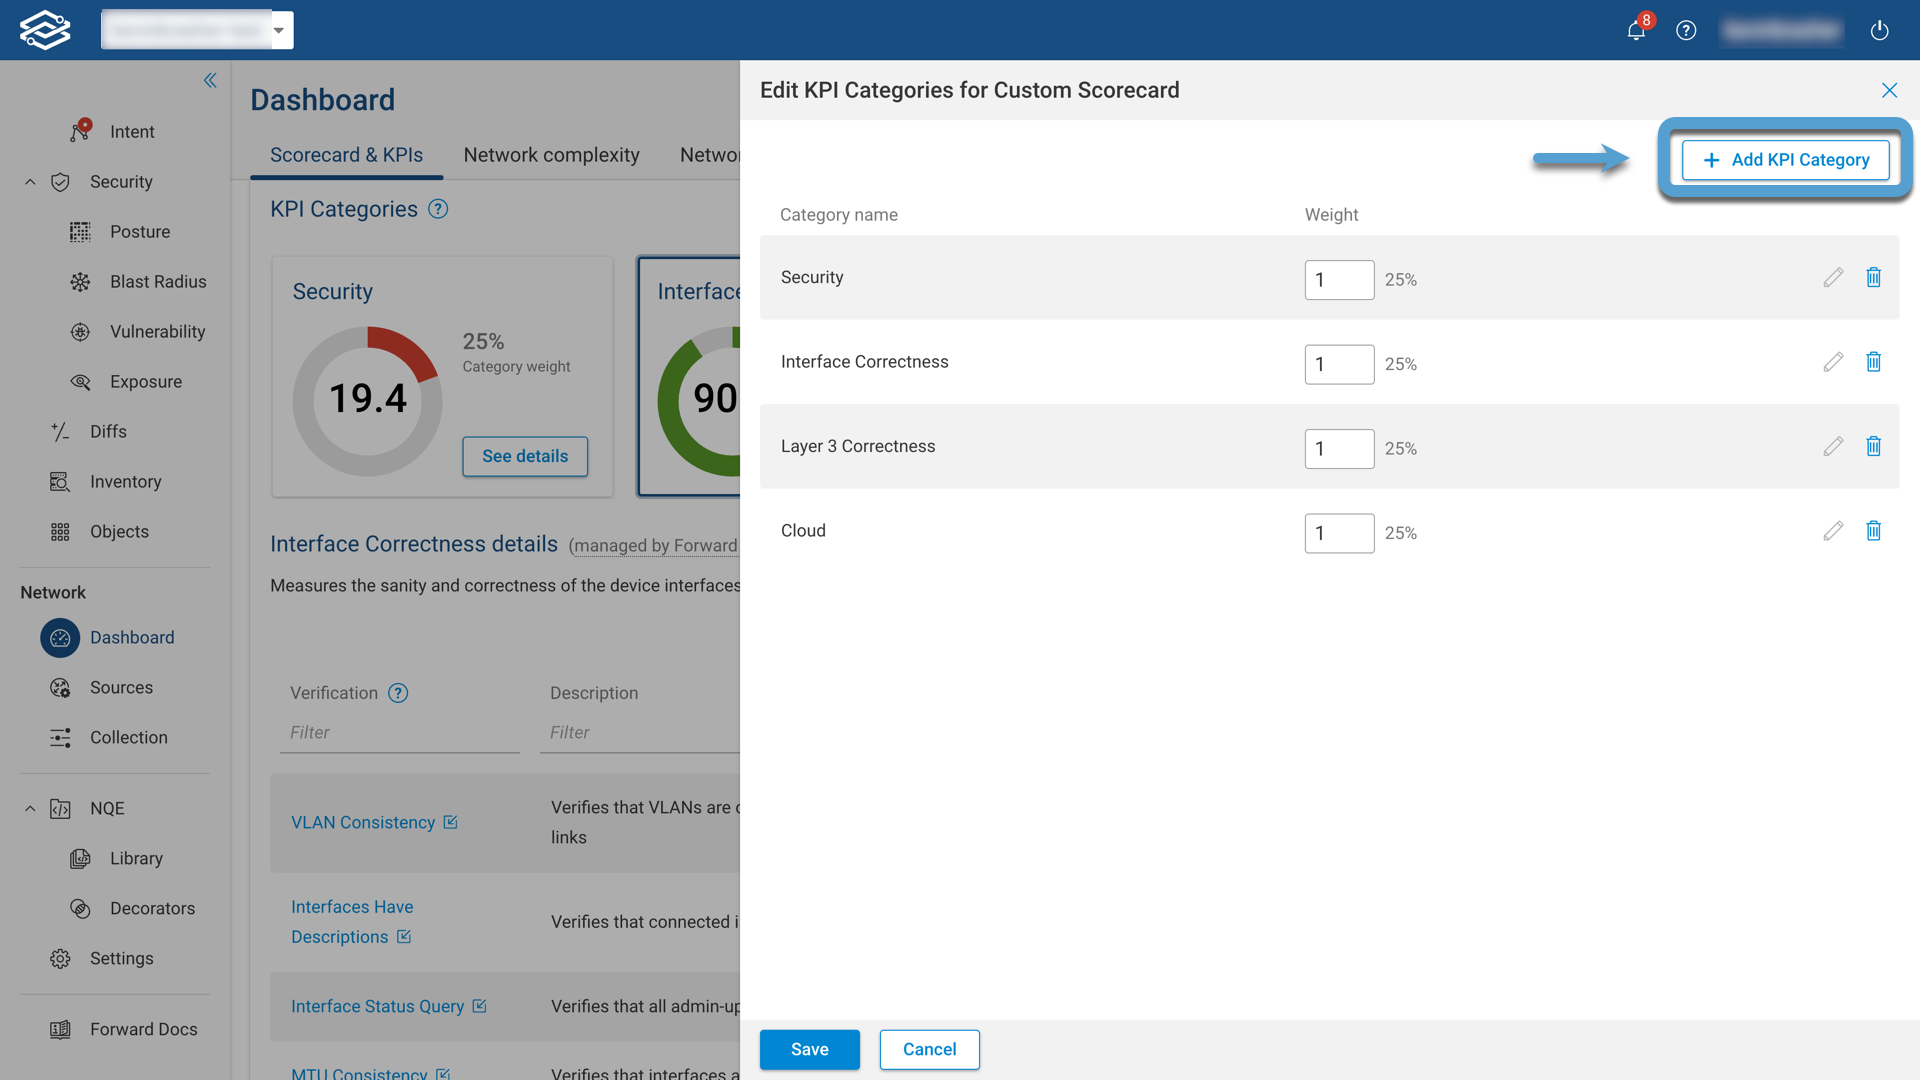
To add a KPI category to a scorecard, select Edit KPI categories from the scorecard’s detail page, and select Add KPI Category from within the Edit KPI Category window.
Select existing KPI categories to add (optional)
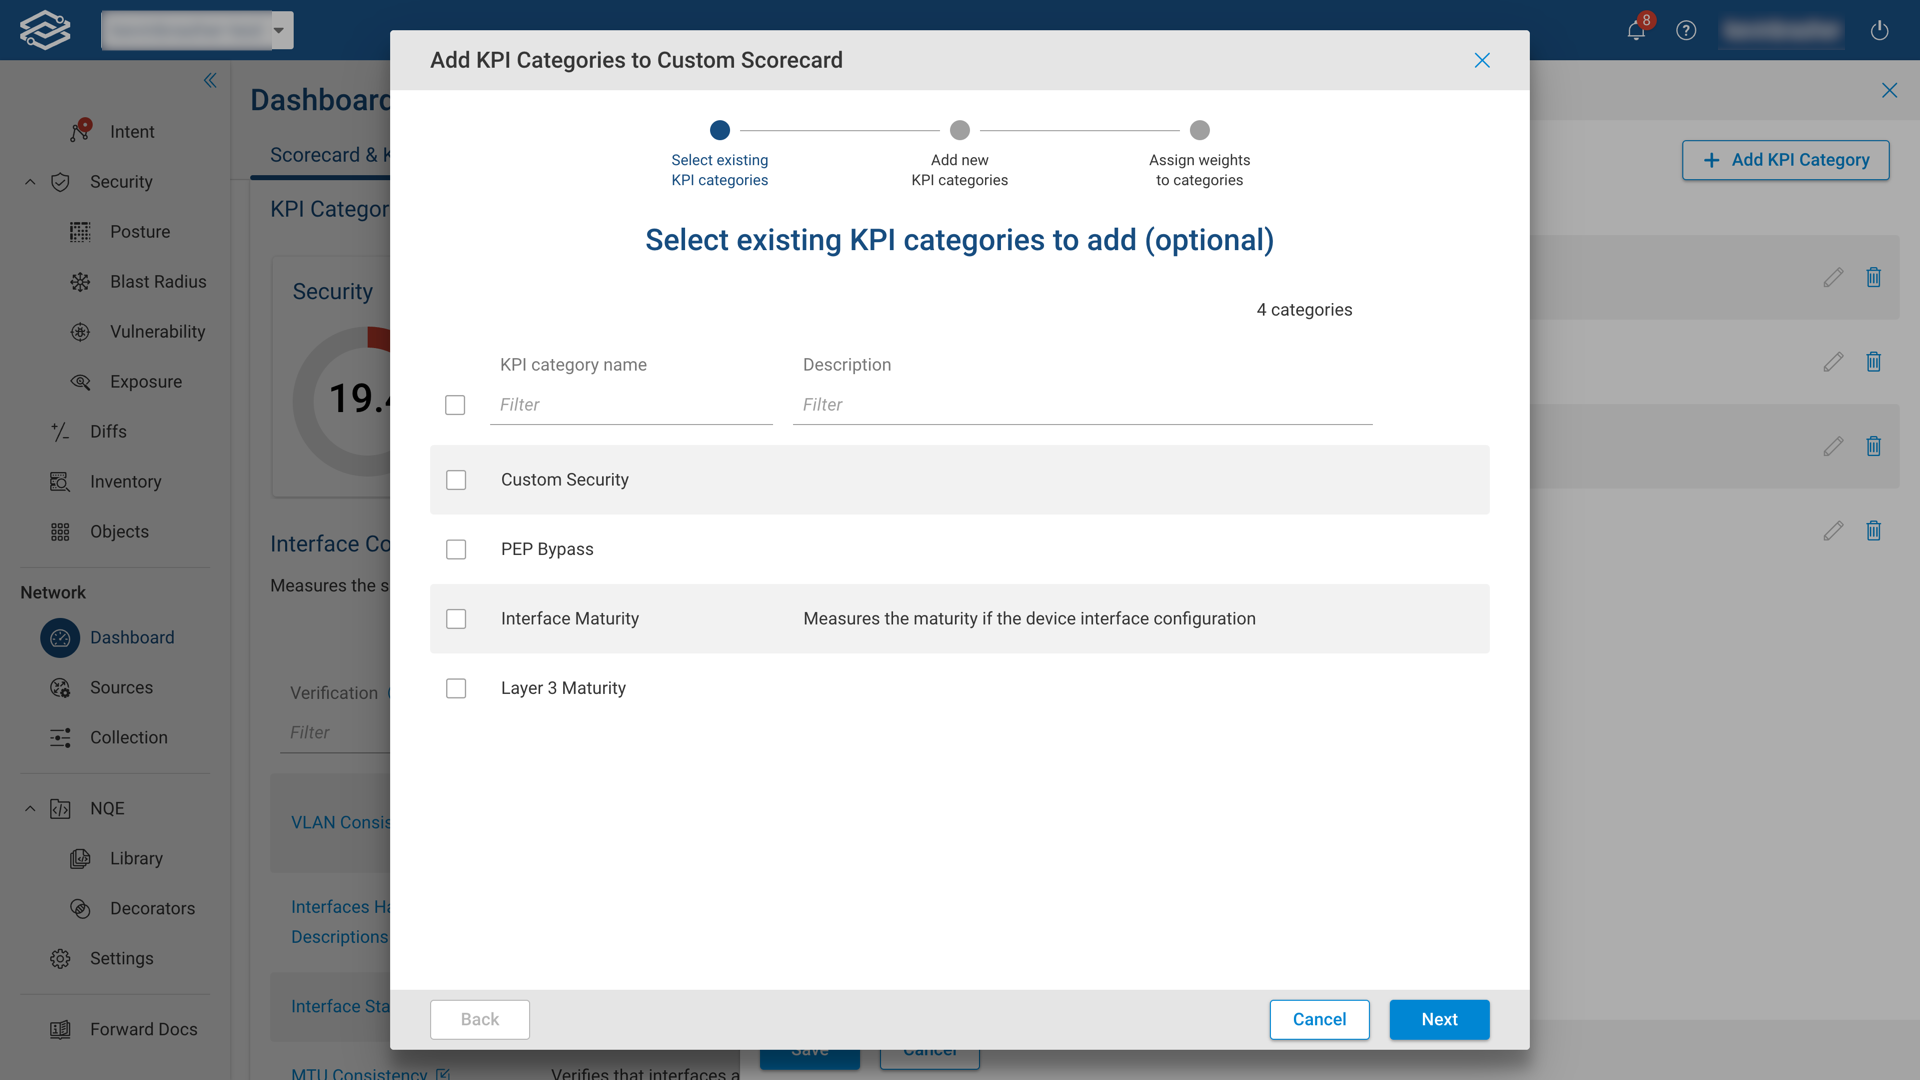
Select from the list of existing KPI categories to add to the scorecard. This step is optional and can be skipped.
Select Next to continue.
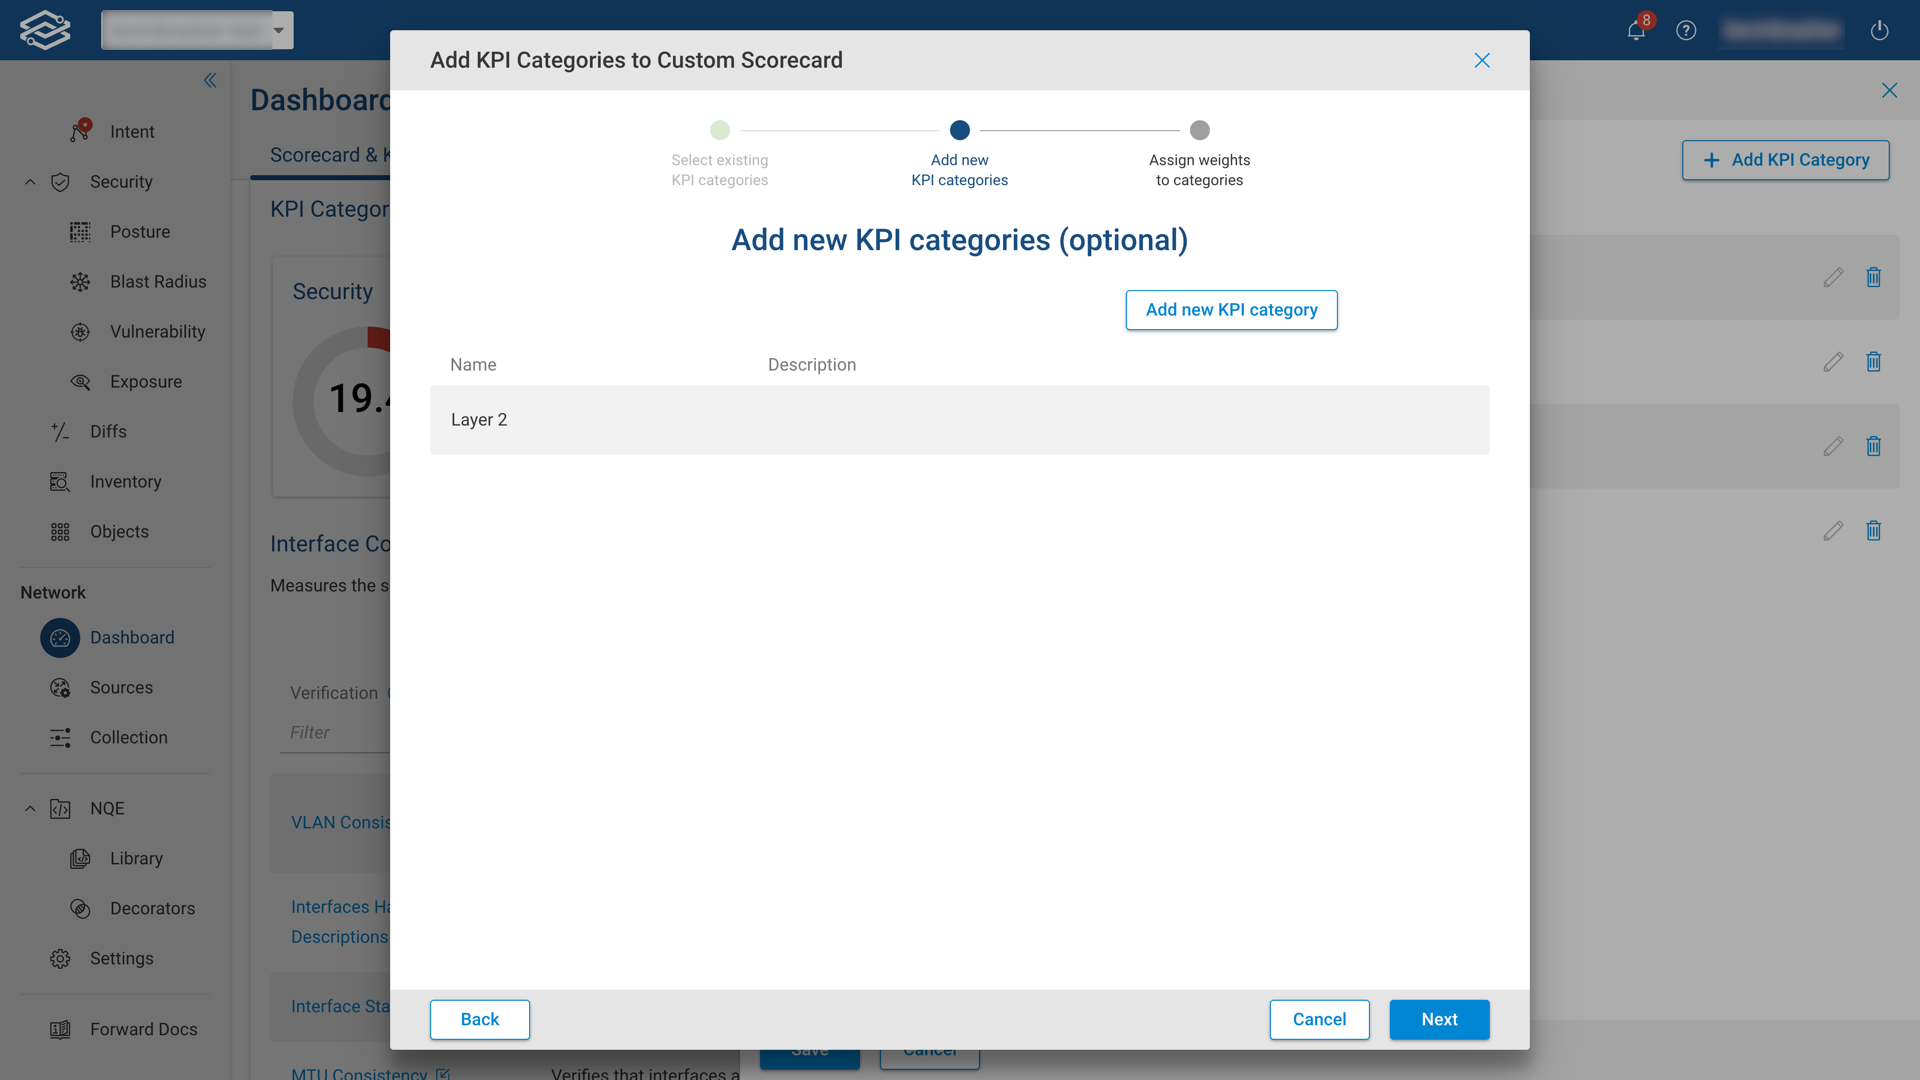
Add new KPI categories (optional)
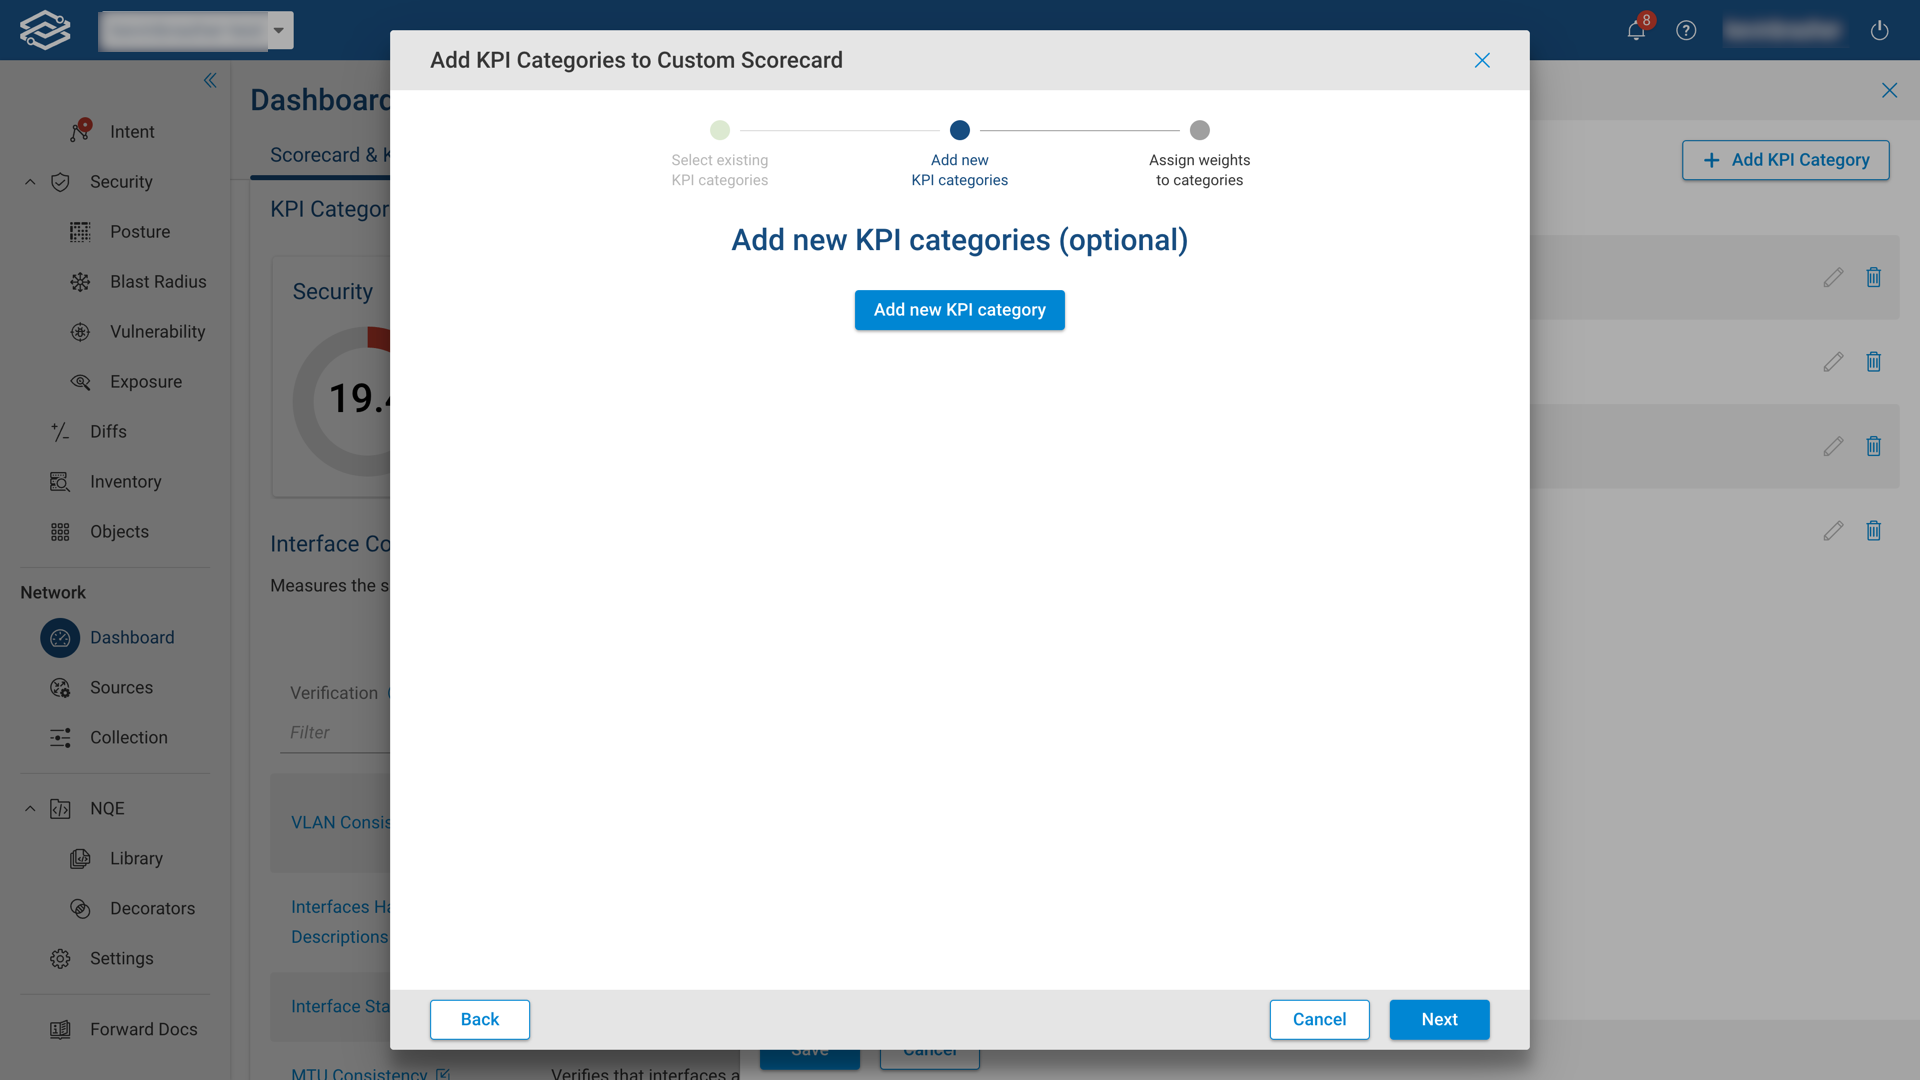
Select Add new KPI category to start creating new KPI categories.
This step is optional, and can be skipped by selecting Next. Proceed to the Assign weights to KPI categories section of the documentation, if a new KPI category is not needed.
Creating a New KPI Category
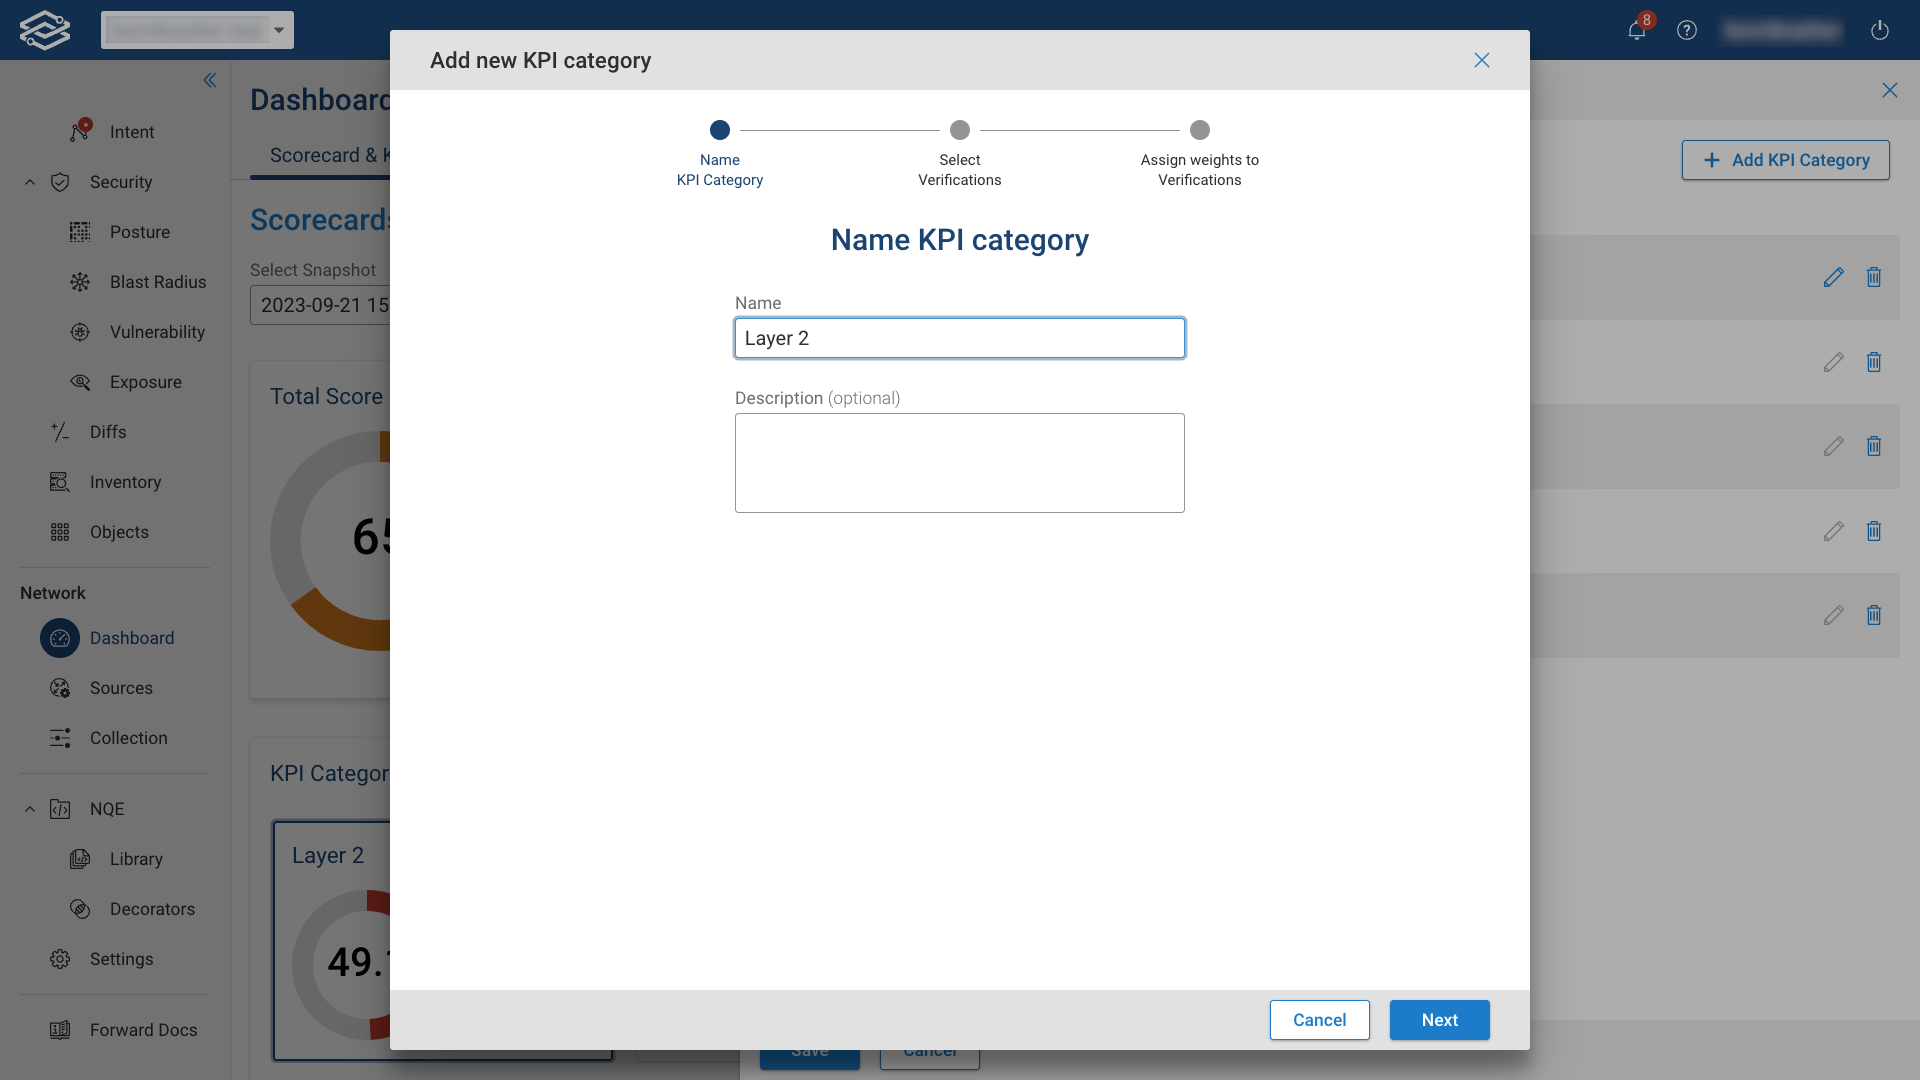
Provide a unique name and optional description for the new KPI category.
Select Next to continue.
Assign New Verifications
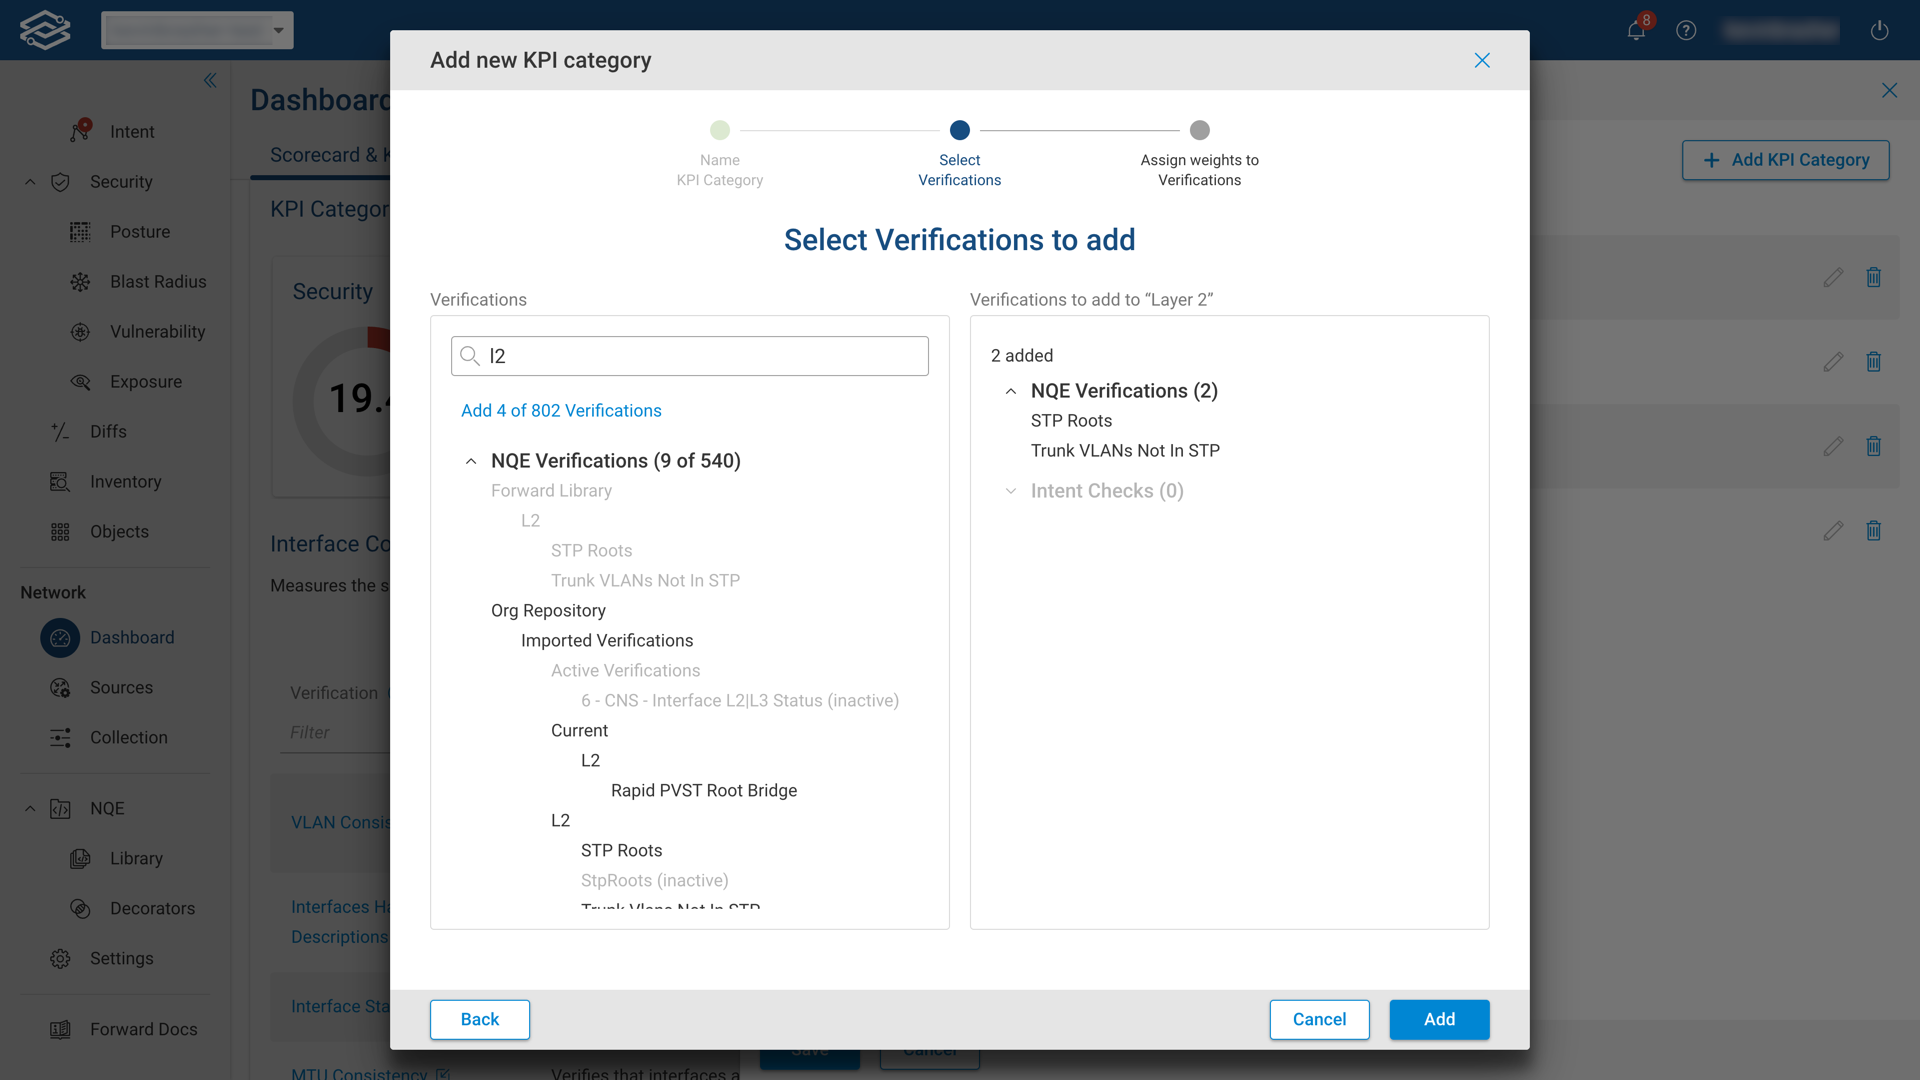
Select from the list of available verifications checks to include.
Select Add to continue.
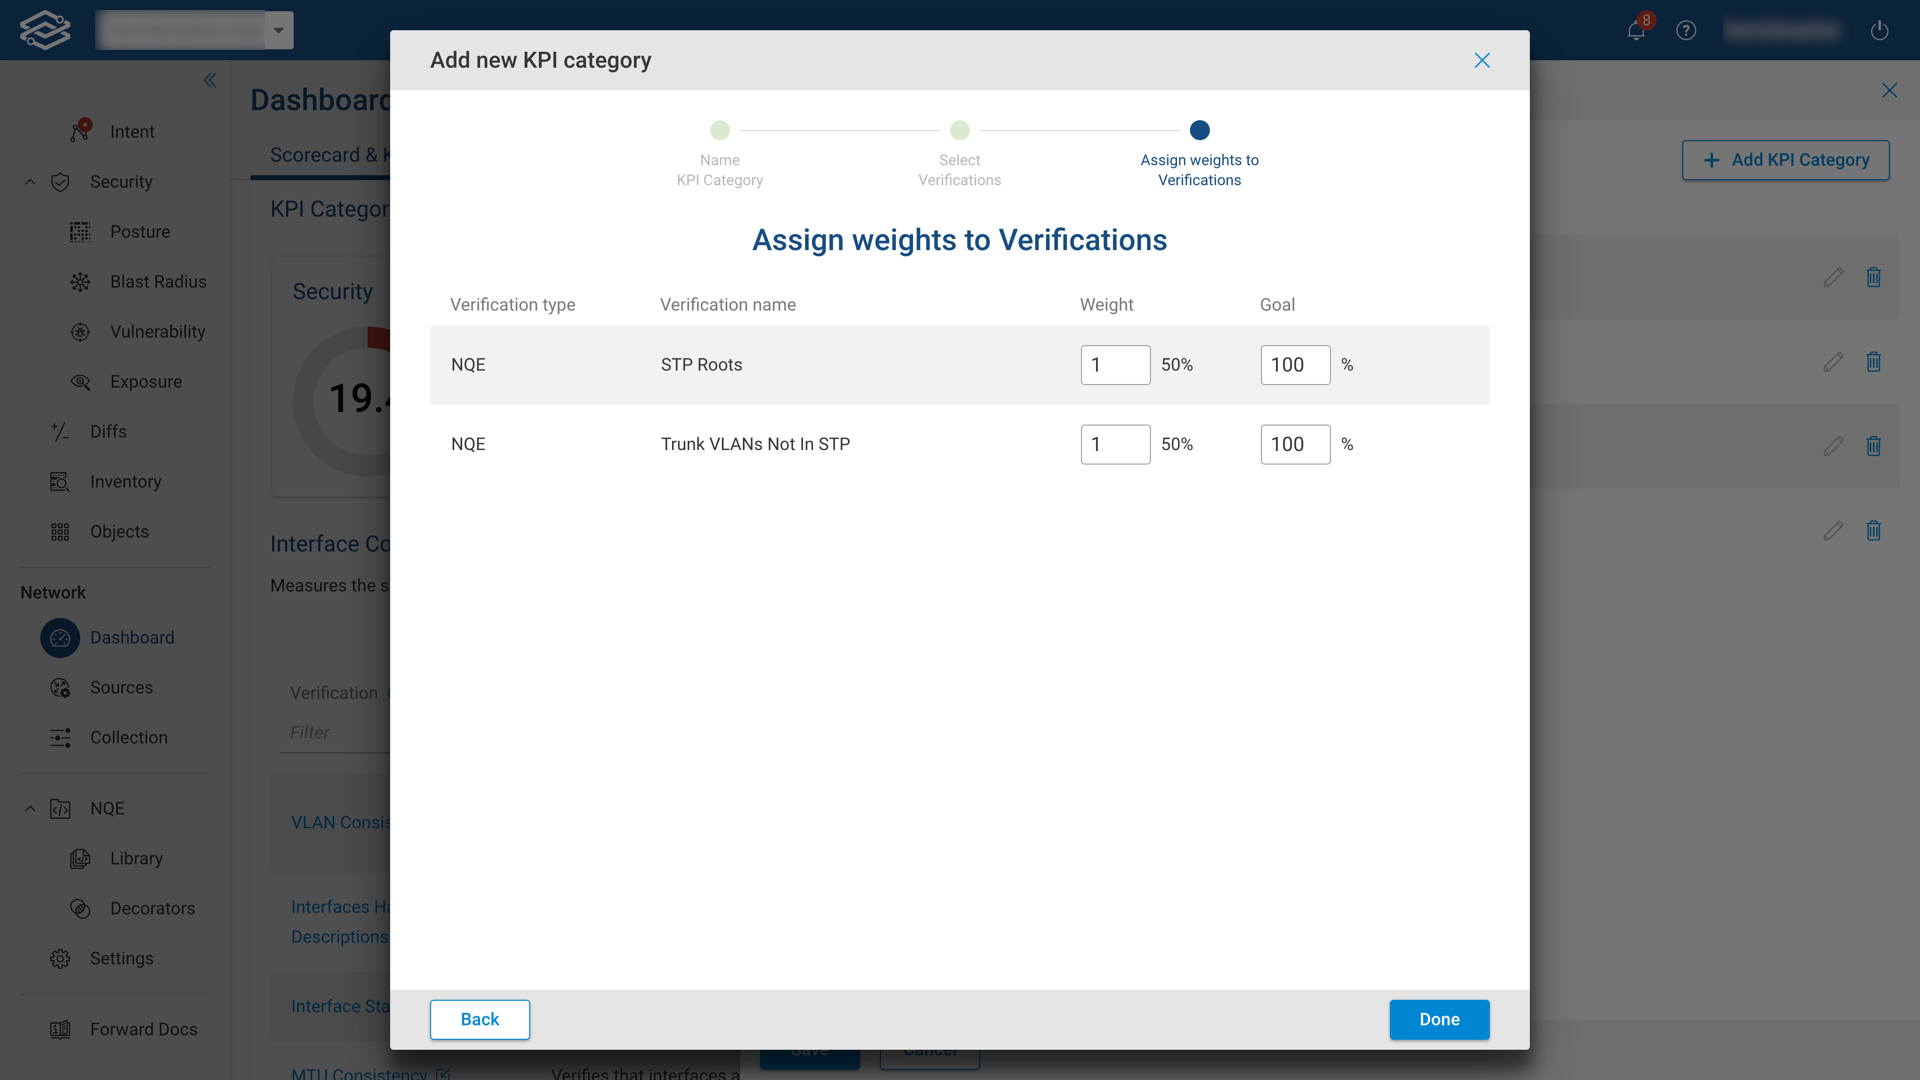
Assign weights to Verifications
Assign a weight and goal for each verification.
Select Done to continue.
Verify Newly Added KPI Categories
Verify all newly added KPI categories are listed and select Next to continue.
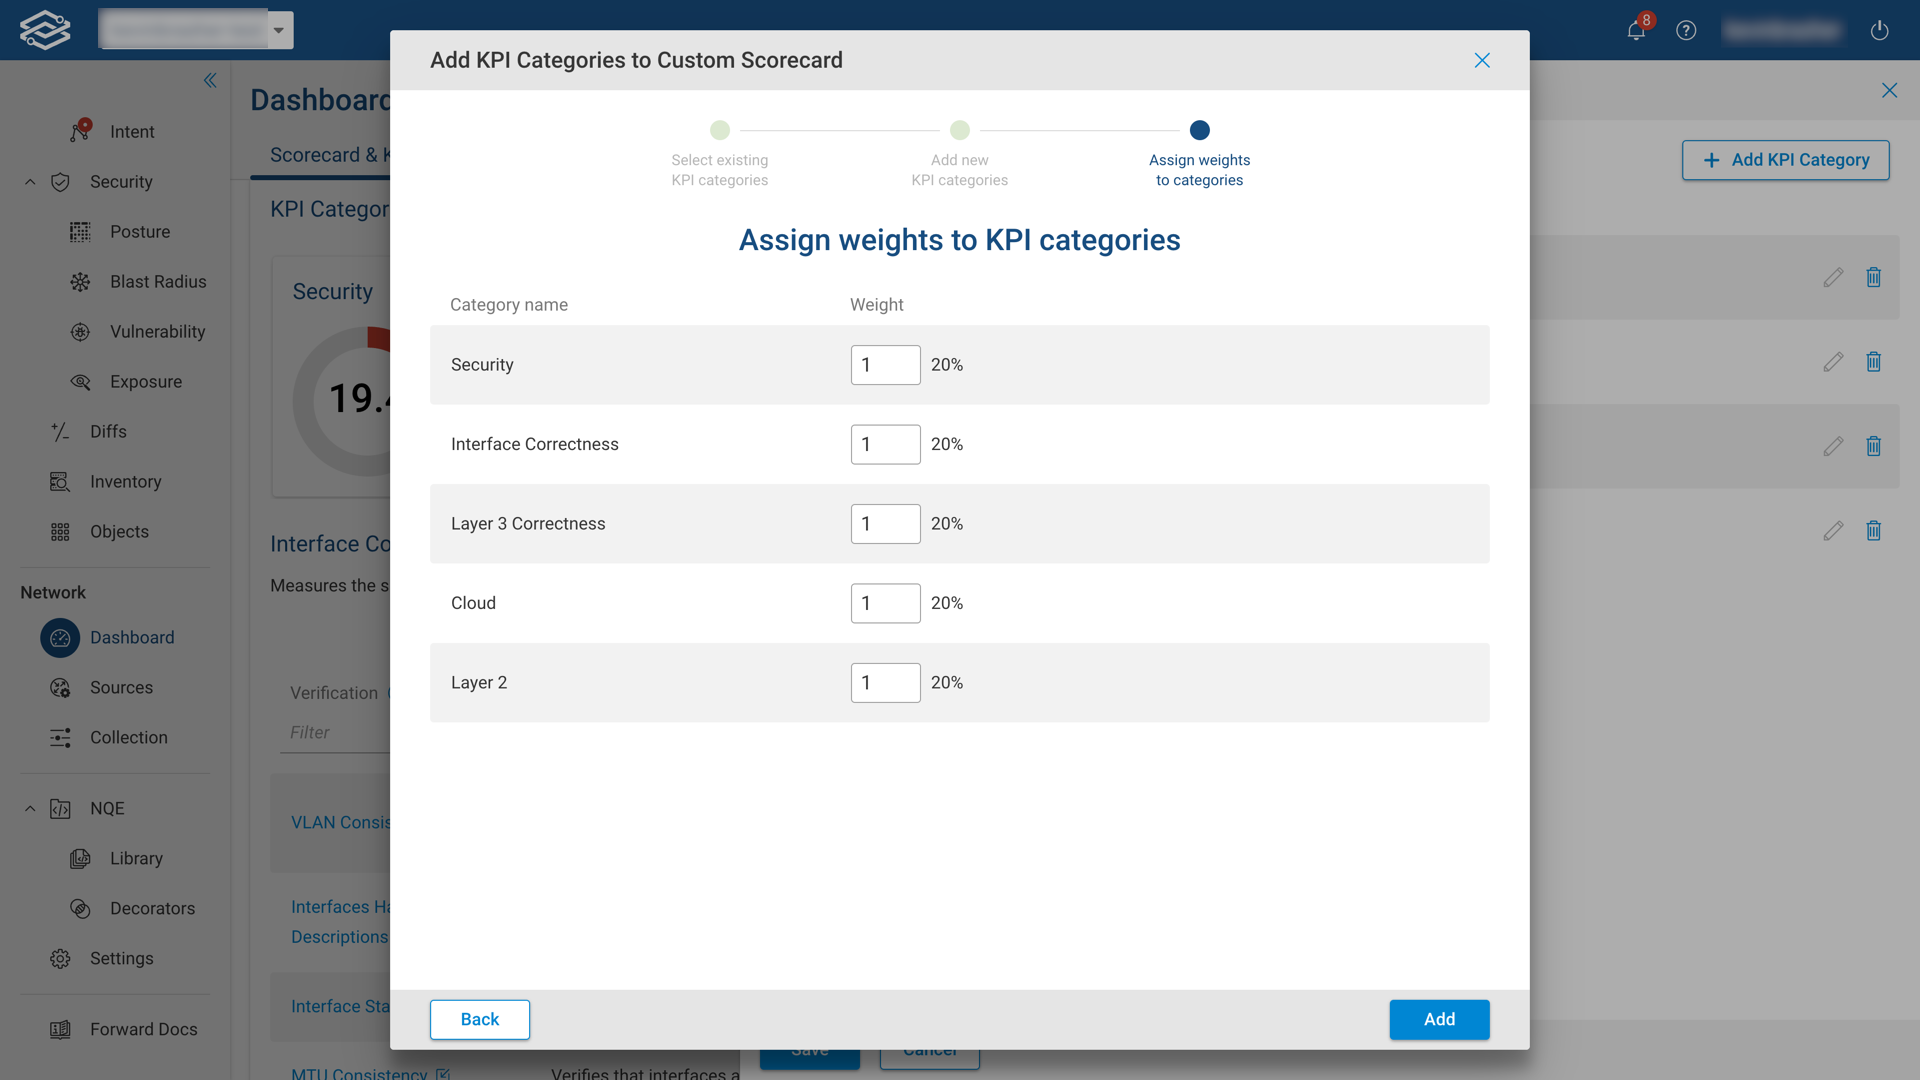
Assign Weights to KPI categories
Assign a numeric value to the weight field of each category.
Select Add to continue.
Navigating back to the KPI Category section of the scorecard will display the newly assigned KPI categories.
Network Complexity Dashboard
The network complexity dashboard has two parts: On-prem and Cloud.
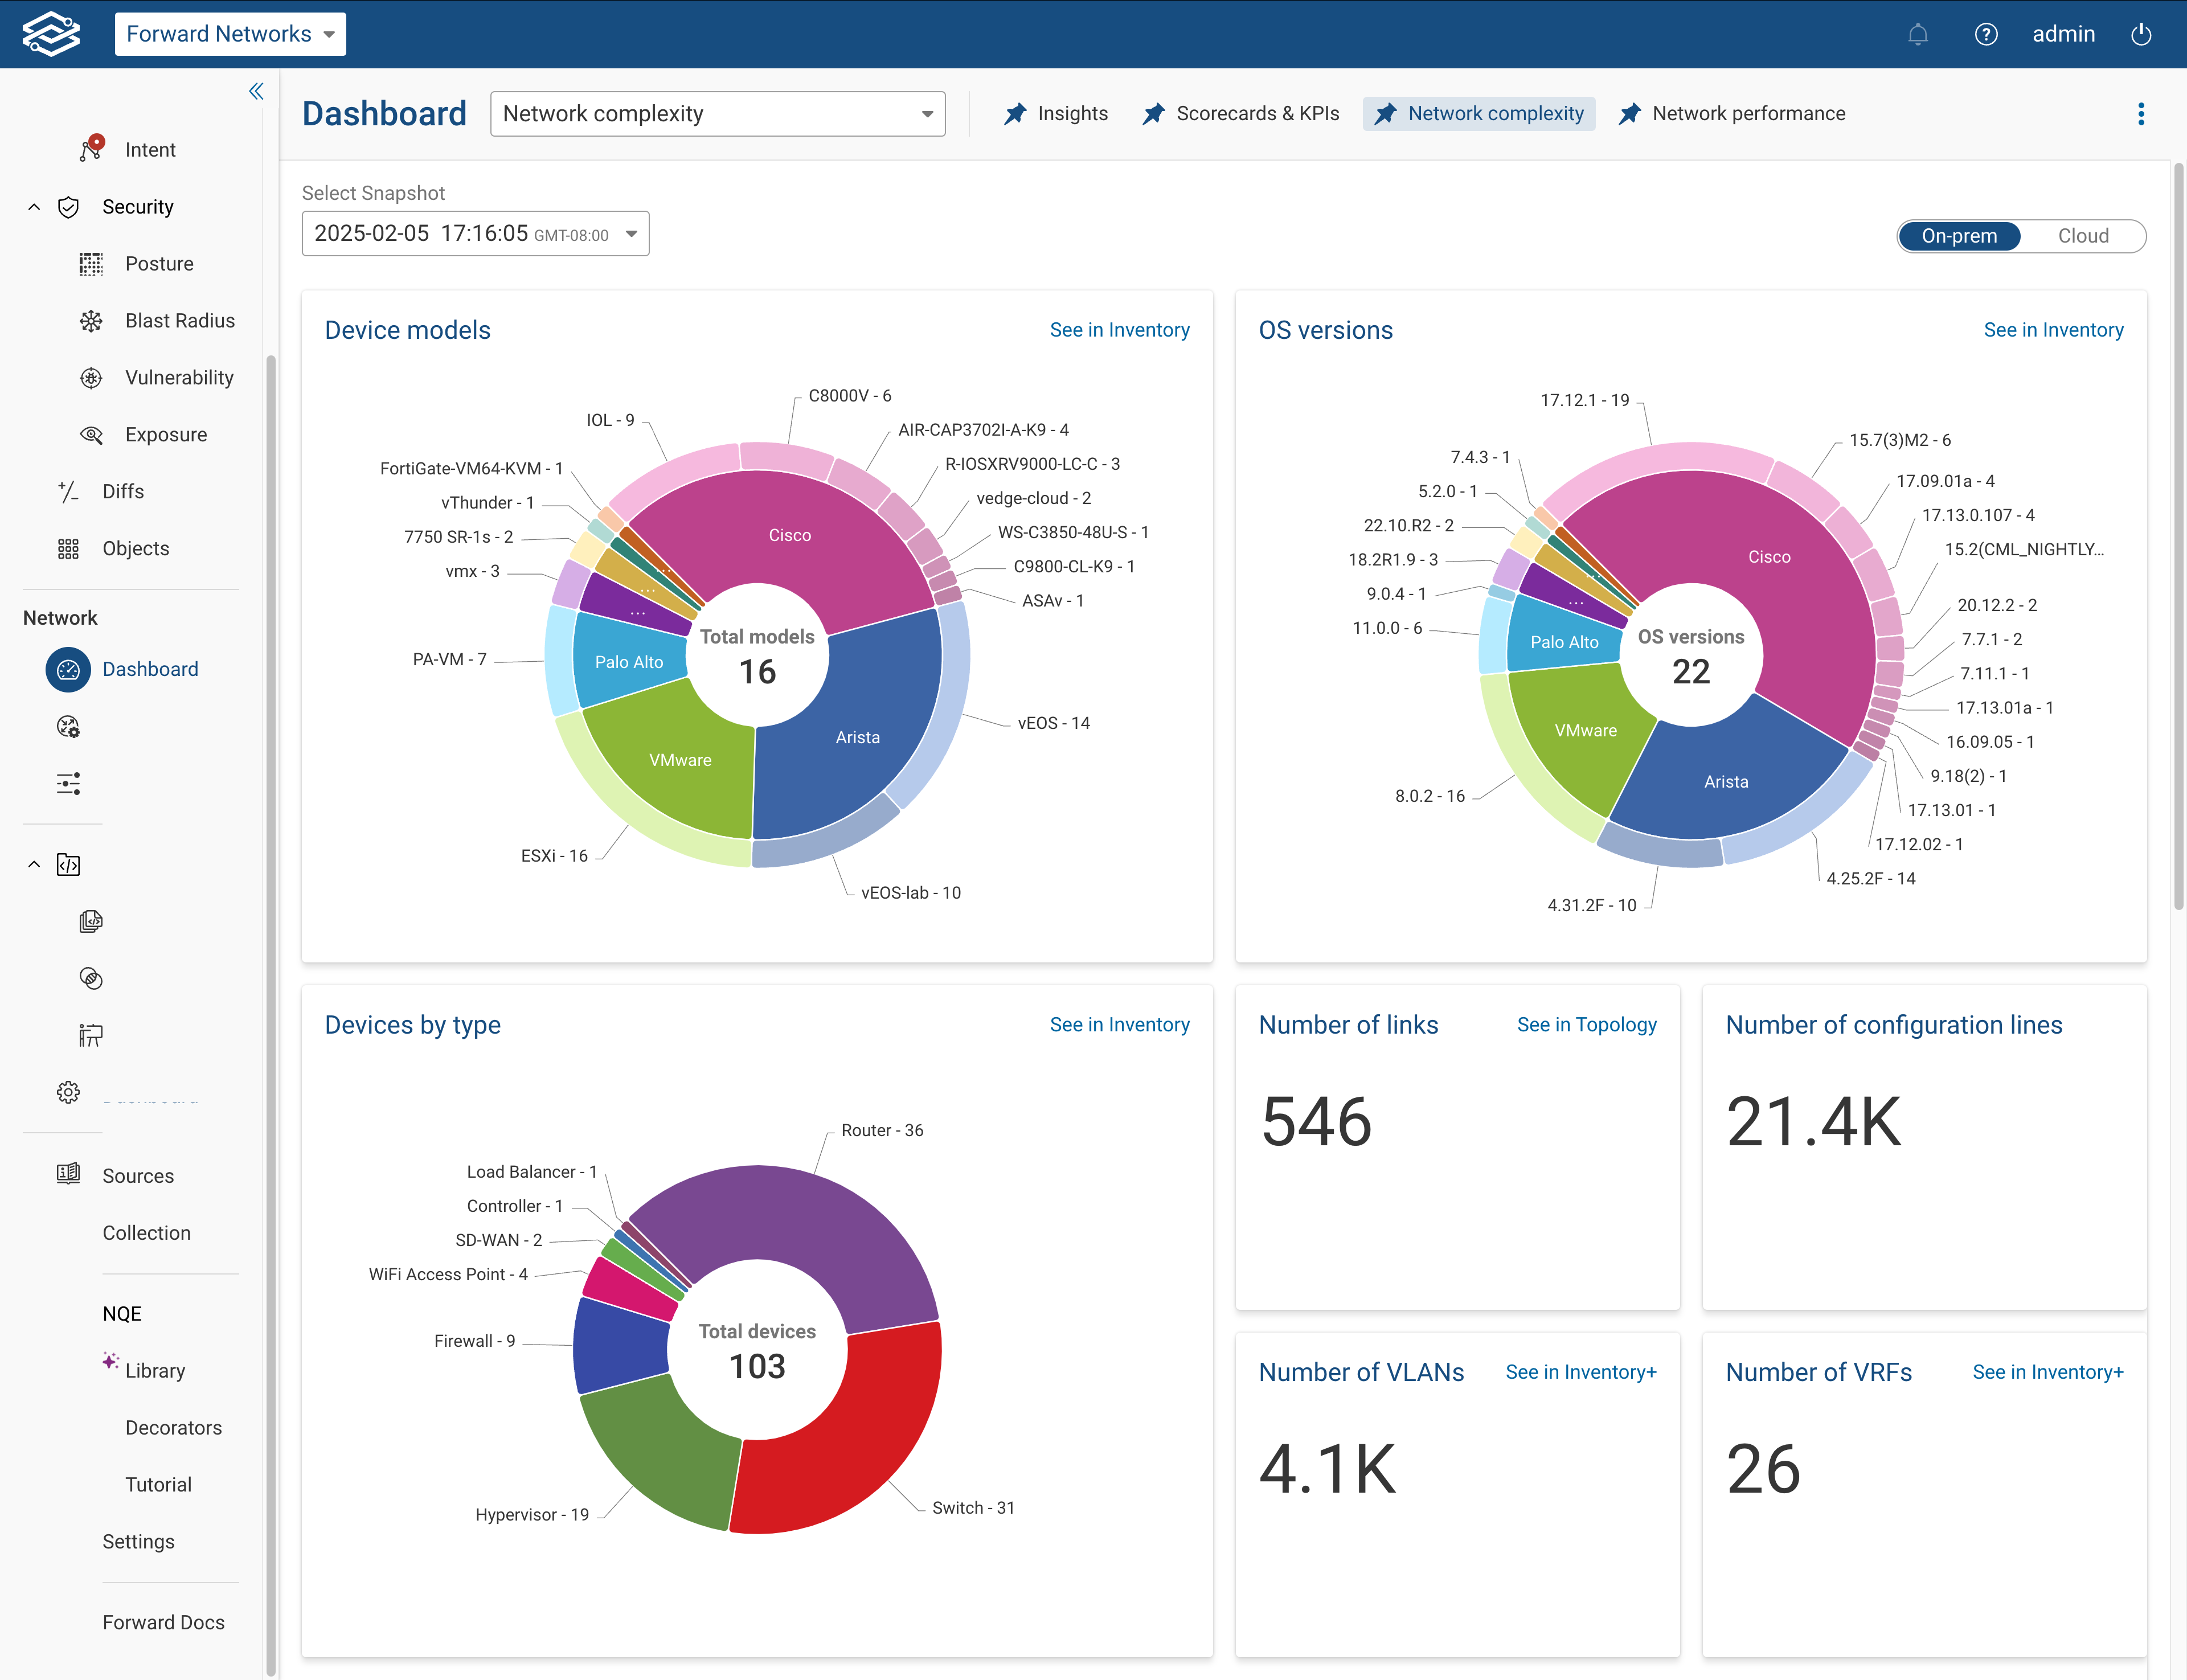
On-prem Network Complexity
The on-prem network complexity dashboard provides insights on: device models, OS versions, device by type, number of links, number of configuration lines, number of VLANs, and number of VRFs.
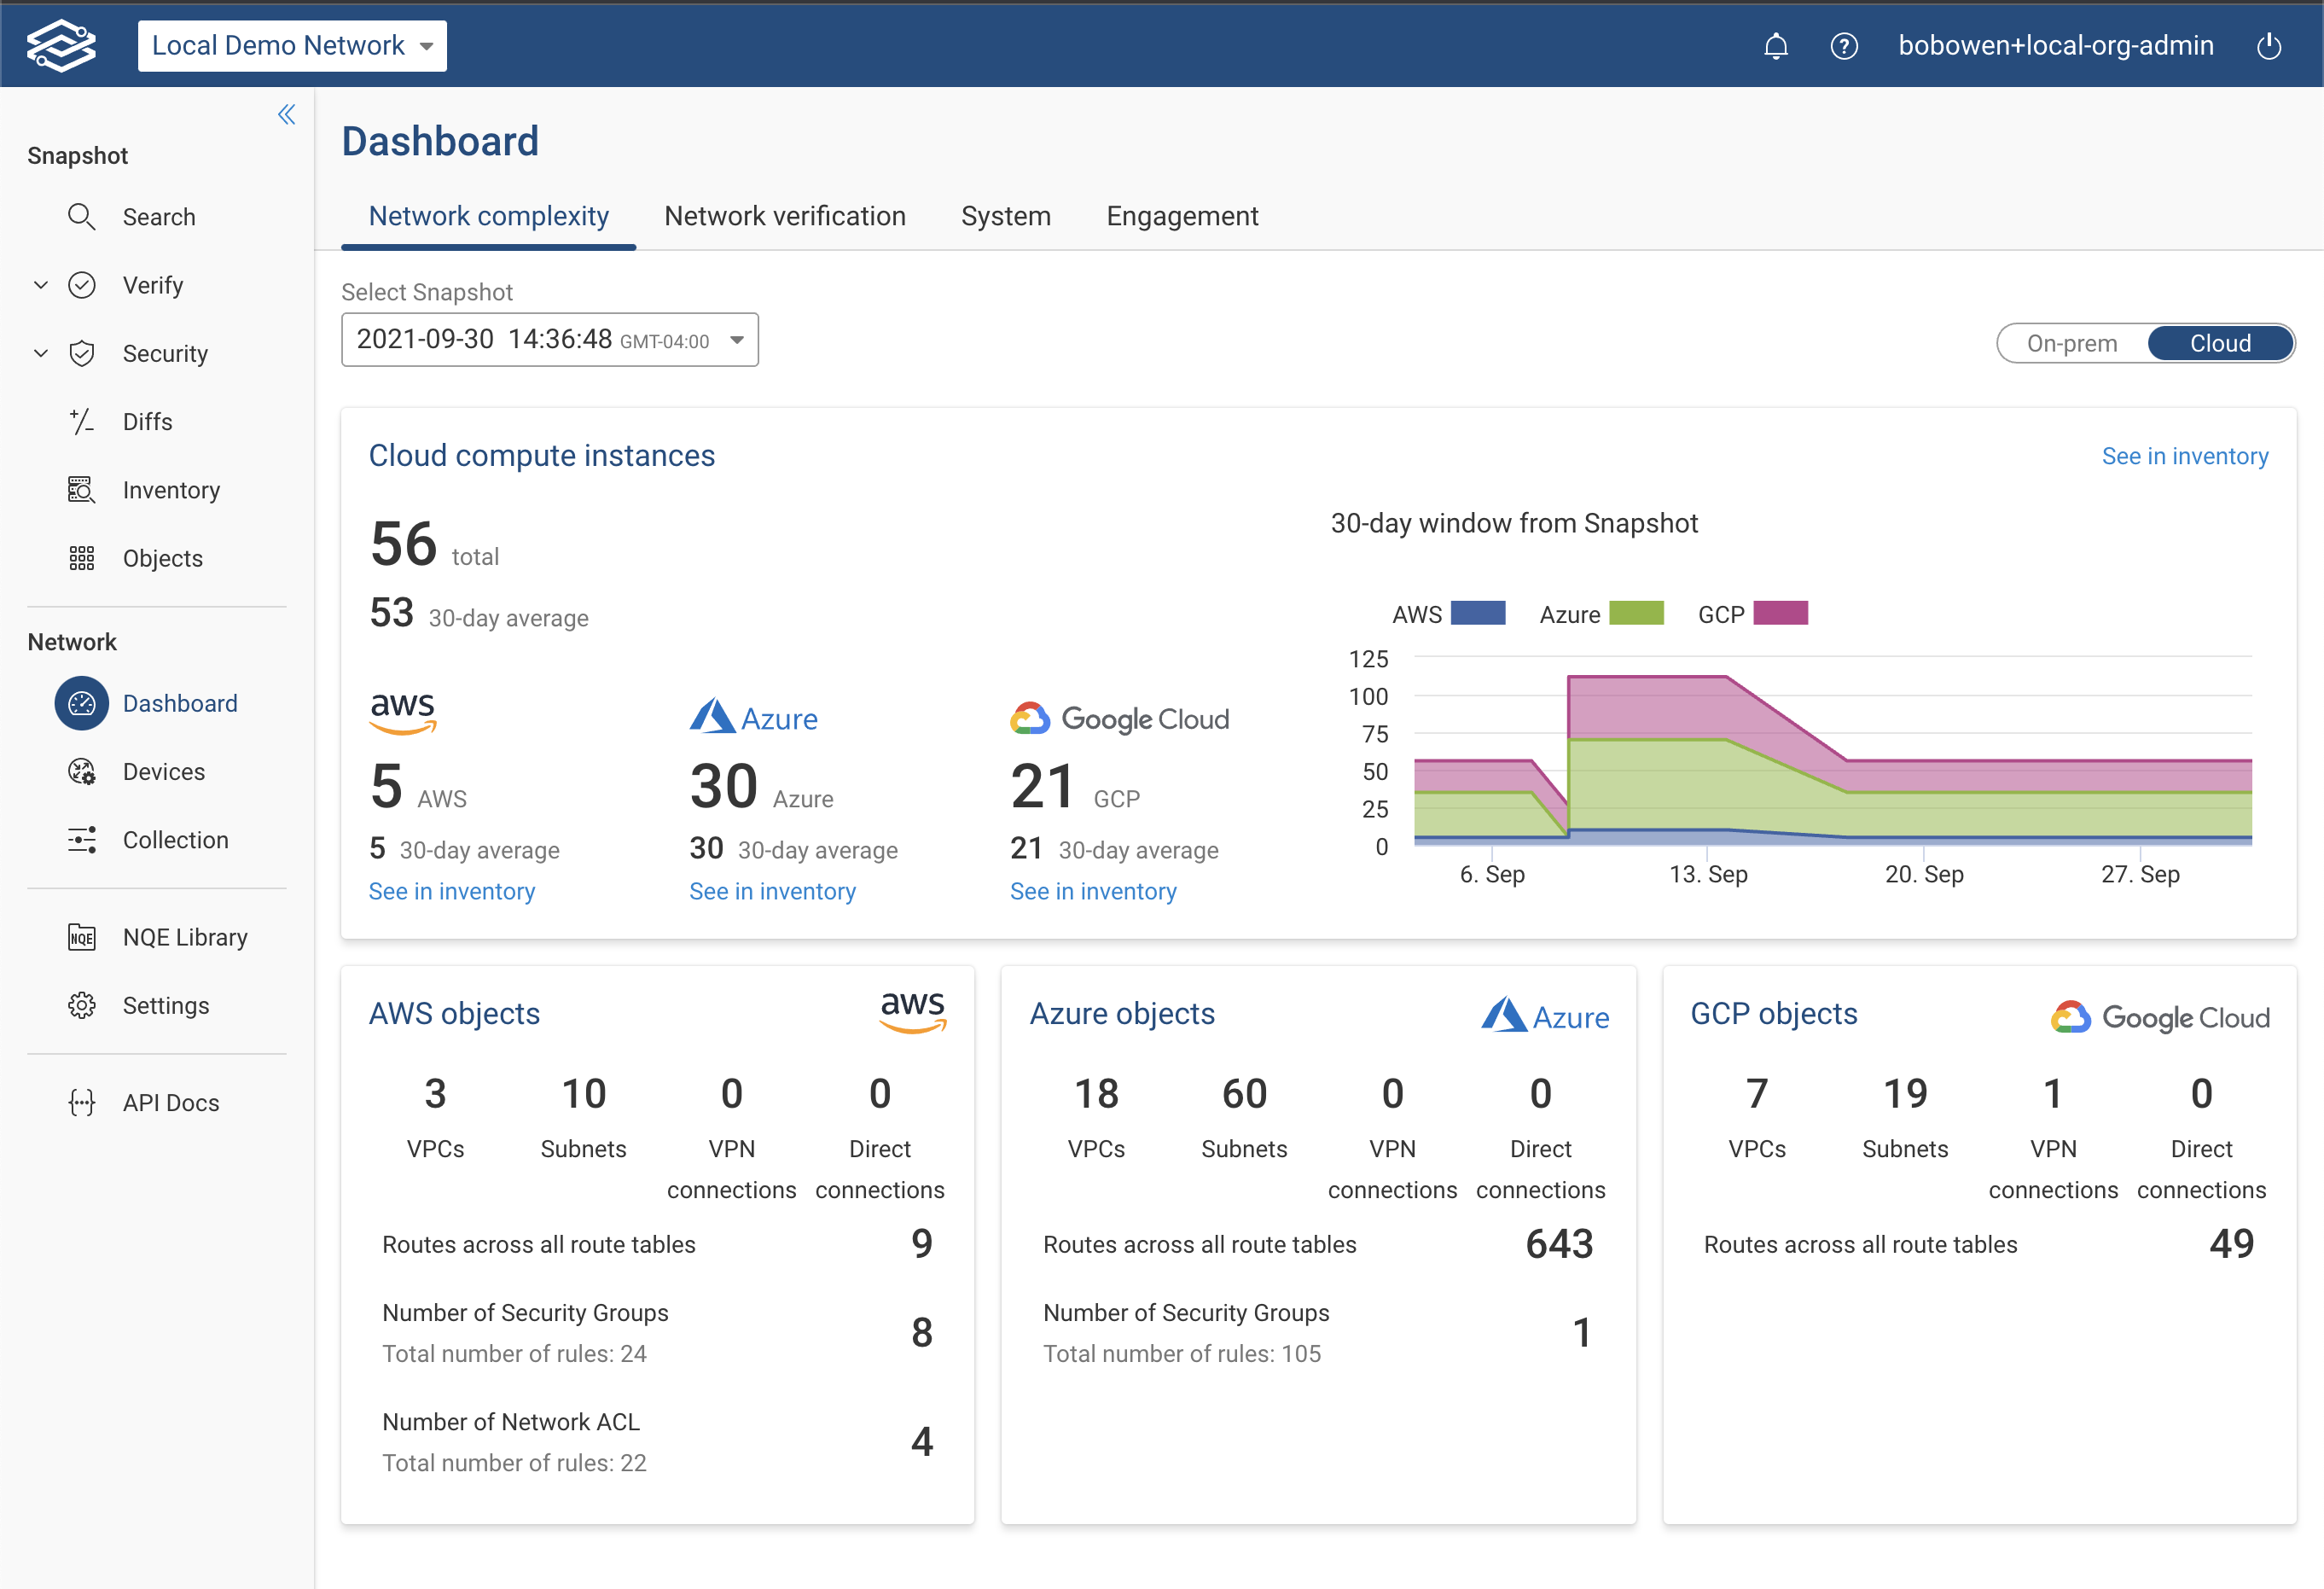
Cloud Network Complexity
The cloud network complexity dashboard provides insights for cloud platforms, such as: AWS, Azure and GCP. The total number of compute instances are listed for the selected snapshot, with a 30-day average number of instances. The graph shows the distribution of average instances over the last 30 days. If the total number of instances consist of multiple cloud providers, a separate breakdown will be generated for each provider.
The vendor specific cards will show VPCs, subnets, VPN connections, and direct connects for AWS. Express routes will be shown for Azure, and direct interconnects will be shown for GCP with a breakdown for the number of routes, number of security groups, number of network ACLs, and number of managed cloud objects for each of the vendors.
Network Performance Dashboard
The Network Performance Dashboard offers a detailed view of network performance metrics for devices enabled for SNMP collection. It aggregates data such as CPU and memory usage and interface errors to provide insights into device efficiency and network health.
Navigating the Network Performance Dashboard
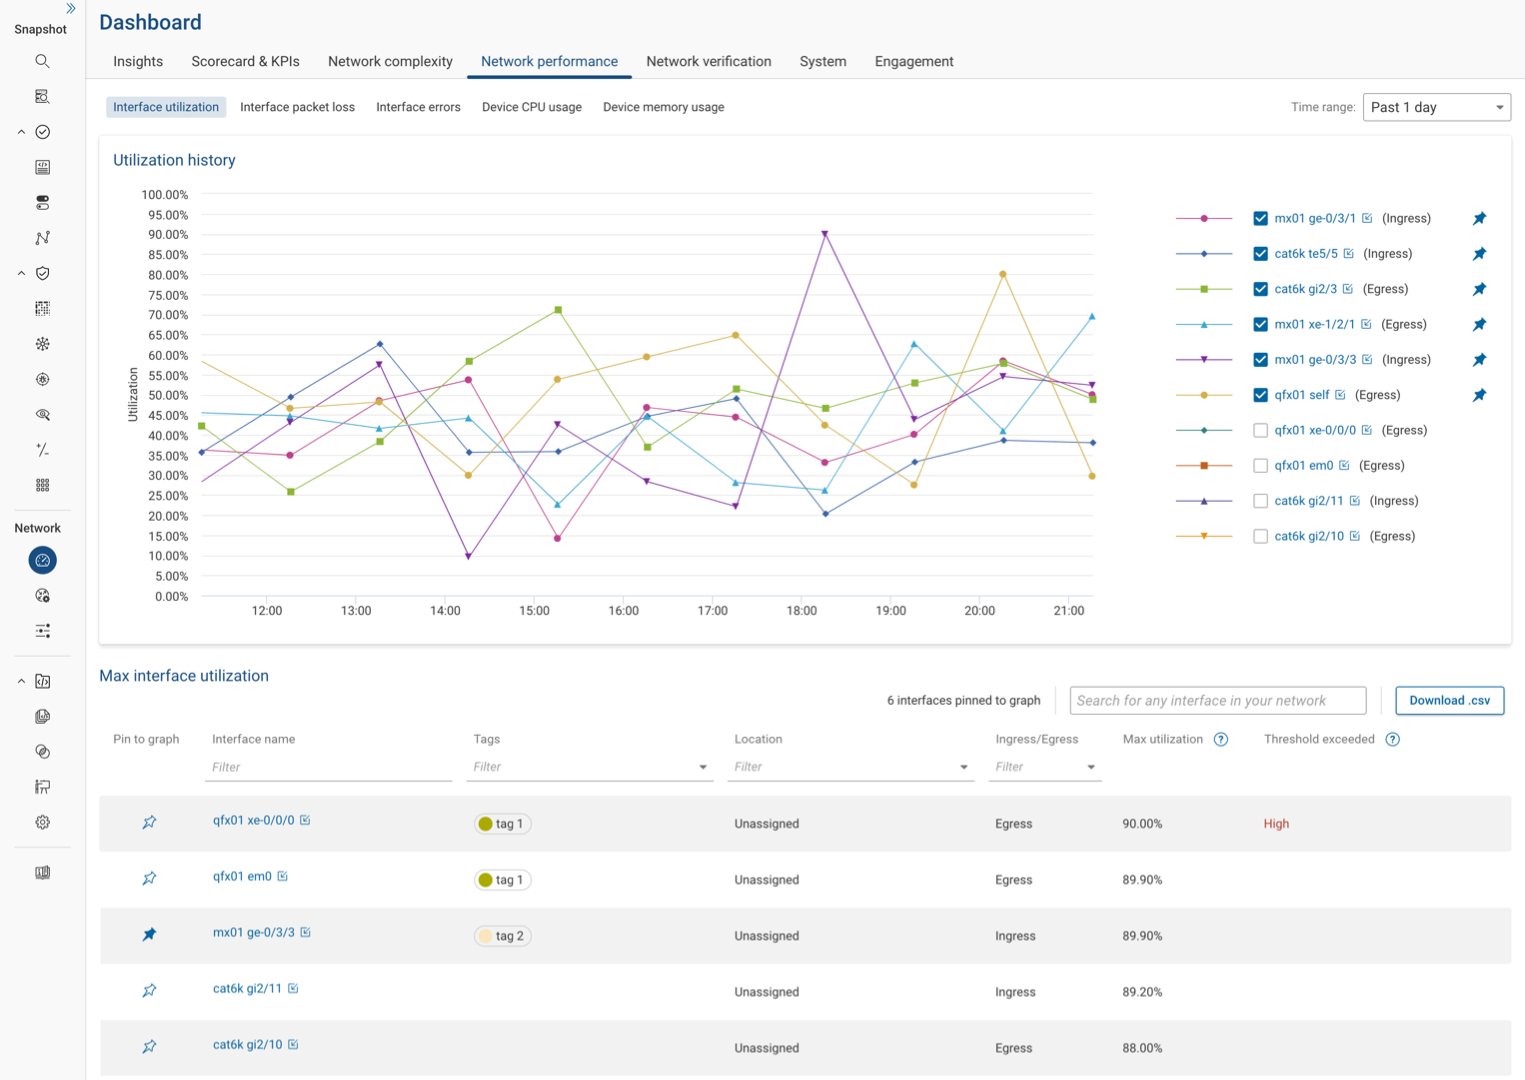
Located under the Network performance tab within the Dashboard page, this dashboard organizes performance metrics into several tabbed views:
- Interface Utilization
- Interface Packet Loss
- Interface Errors
- Device CPU Usage
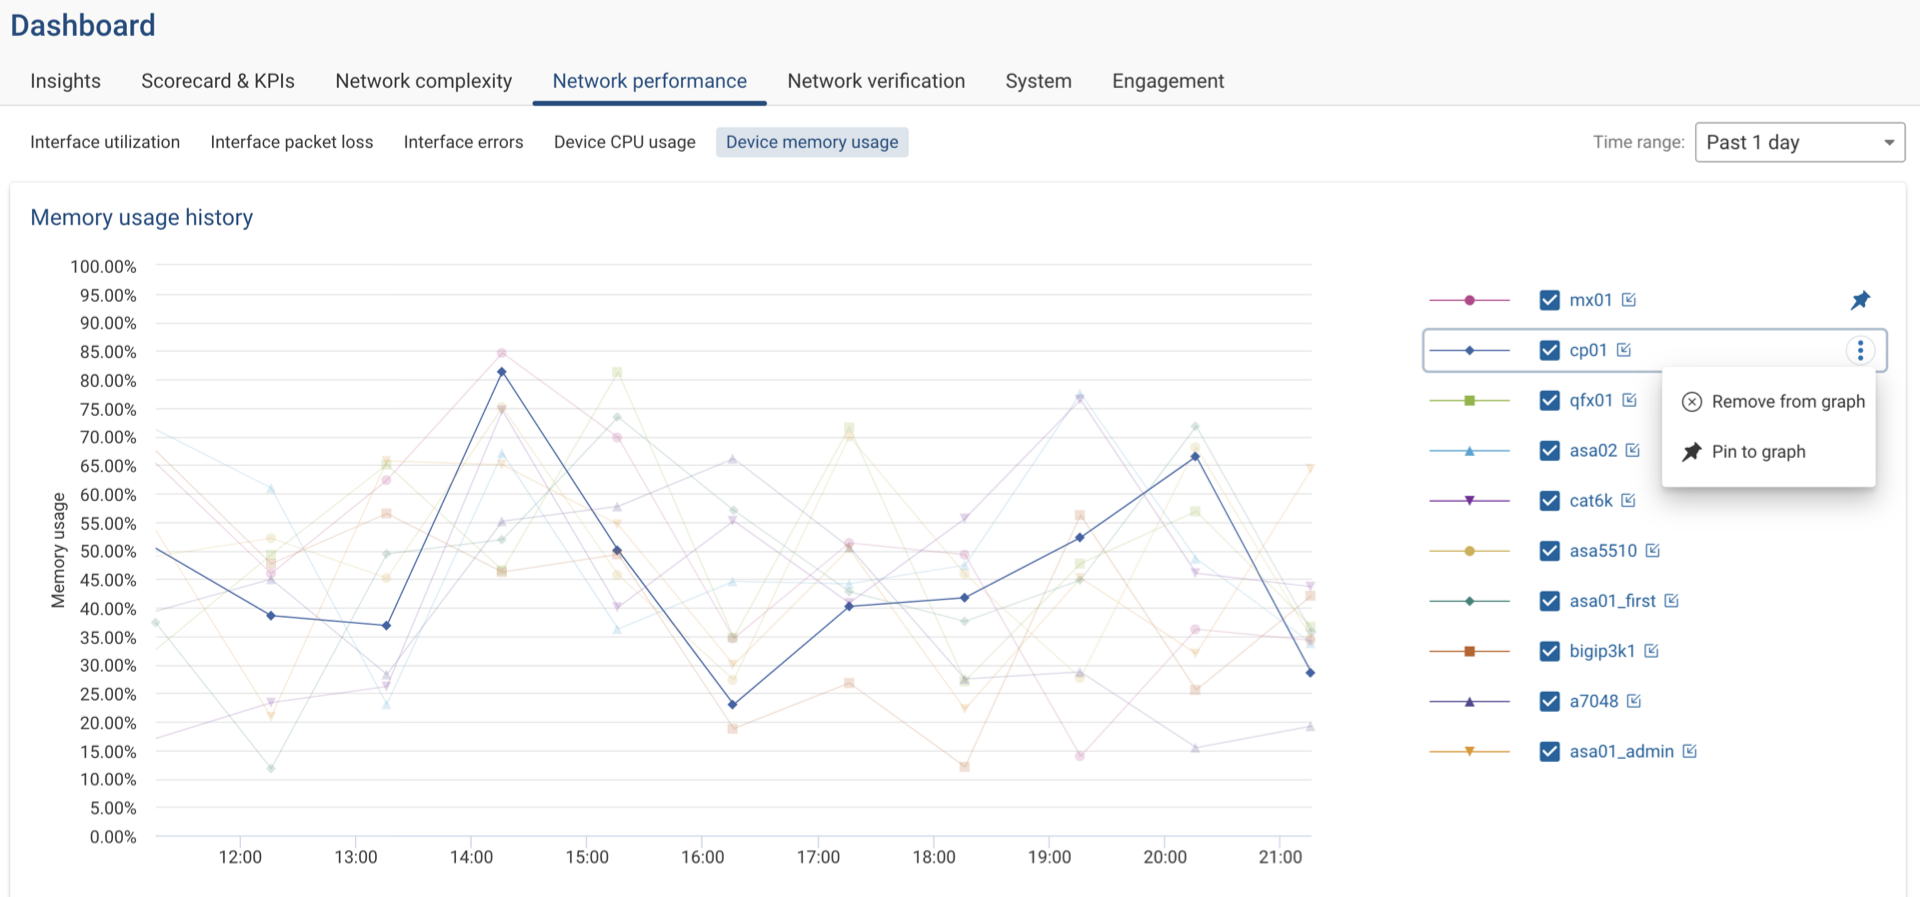
- Device Memory Usage
Each metric is presented through an interactive chart and table. Devices and interfaces are listed and sorted by those exhibiting the highest values for the chosen metric within a selected time range.
Interactivity and Data Customization
- Time Range Selection: Use the Time Range dropdown menu to adjust the displayed historical data to focus on specific periods of interest.
- Graph Interaction: Hovering over a chart line emphasizes it for better visibility. Similarly, interacting with an item in the legend highlights it in the graph, offering a clearer view of specific data points.
- Legend Options: Clicking on additional options in the legend allows you to pin a device or interface to the graph or table, ensuring it remains visible until unpinned.
- Visibility Toggles: Show or hide any interface in the graph using the checkbox next to each name, allowing for a customized data view according to user preference. Clicking on the device or interface name in the legend will focus on the selected item and highlight individual data points in the chart, improving visibility and interactivity with a single interface or device of interest.
- Detailed View Links: Clicking on the link icon in the legend opens a new tab with a detailed view of the selected interface or device, allowing for an in-depth analysis interrupting your current view of the dashboard.
Enabling Performance Data Collection
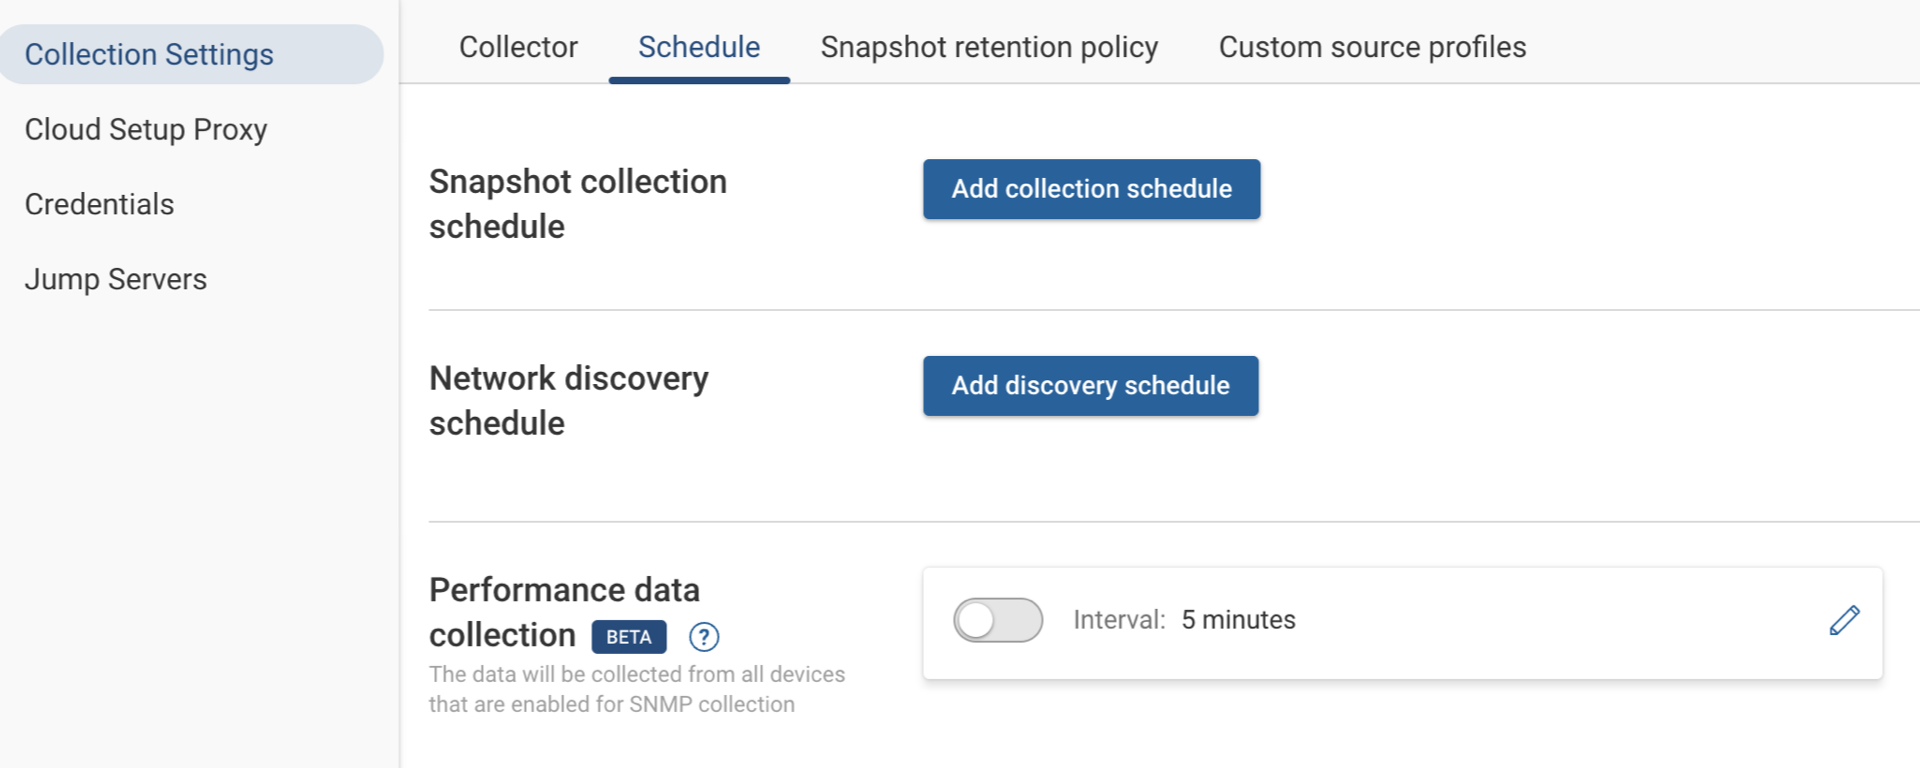
To enable and configure the collection of performance data:
- Navigate to Collection > Collection Settings > Schedule.
- Click the edit icon to modify the frequency of data collection. By default, data is collected every 5 minutes.
- To enable SNMP collection for specific devices; go to the Devices page.
- Select the devices to enable data collection. Click the edit icon, check Enable SNMP Collection, and then click Save to apply the settings.
Network Verification Dashboard
The network verification dashboard provides insights on passing verification and violation checks for devices by failure, and violations by check type.
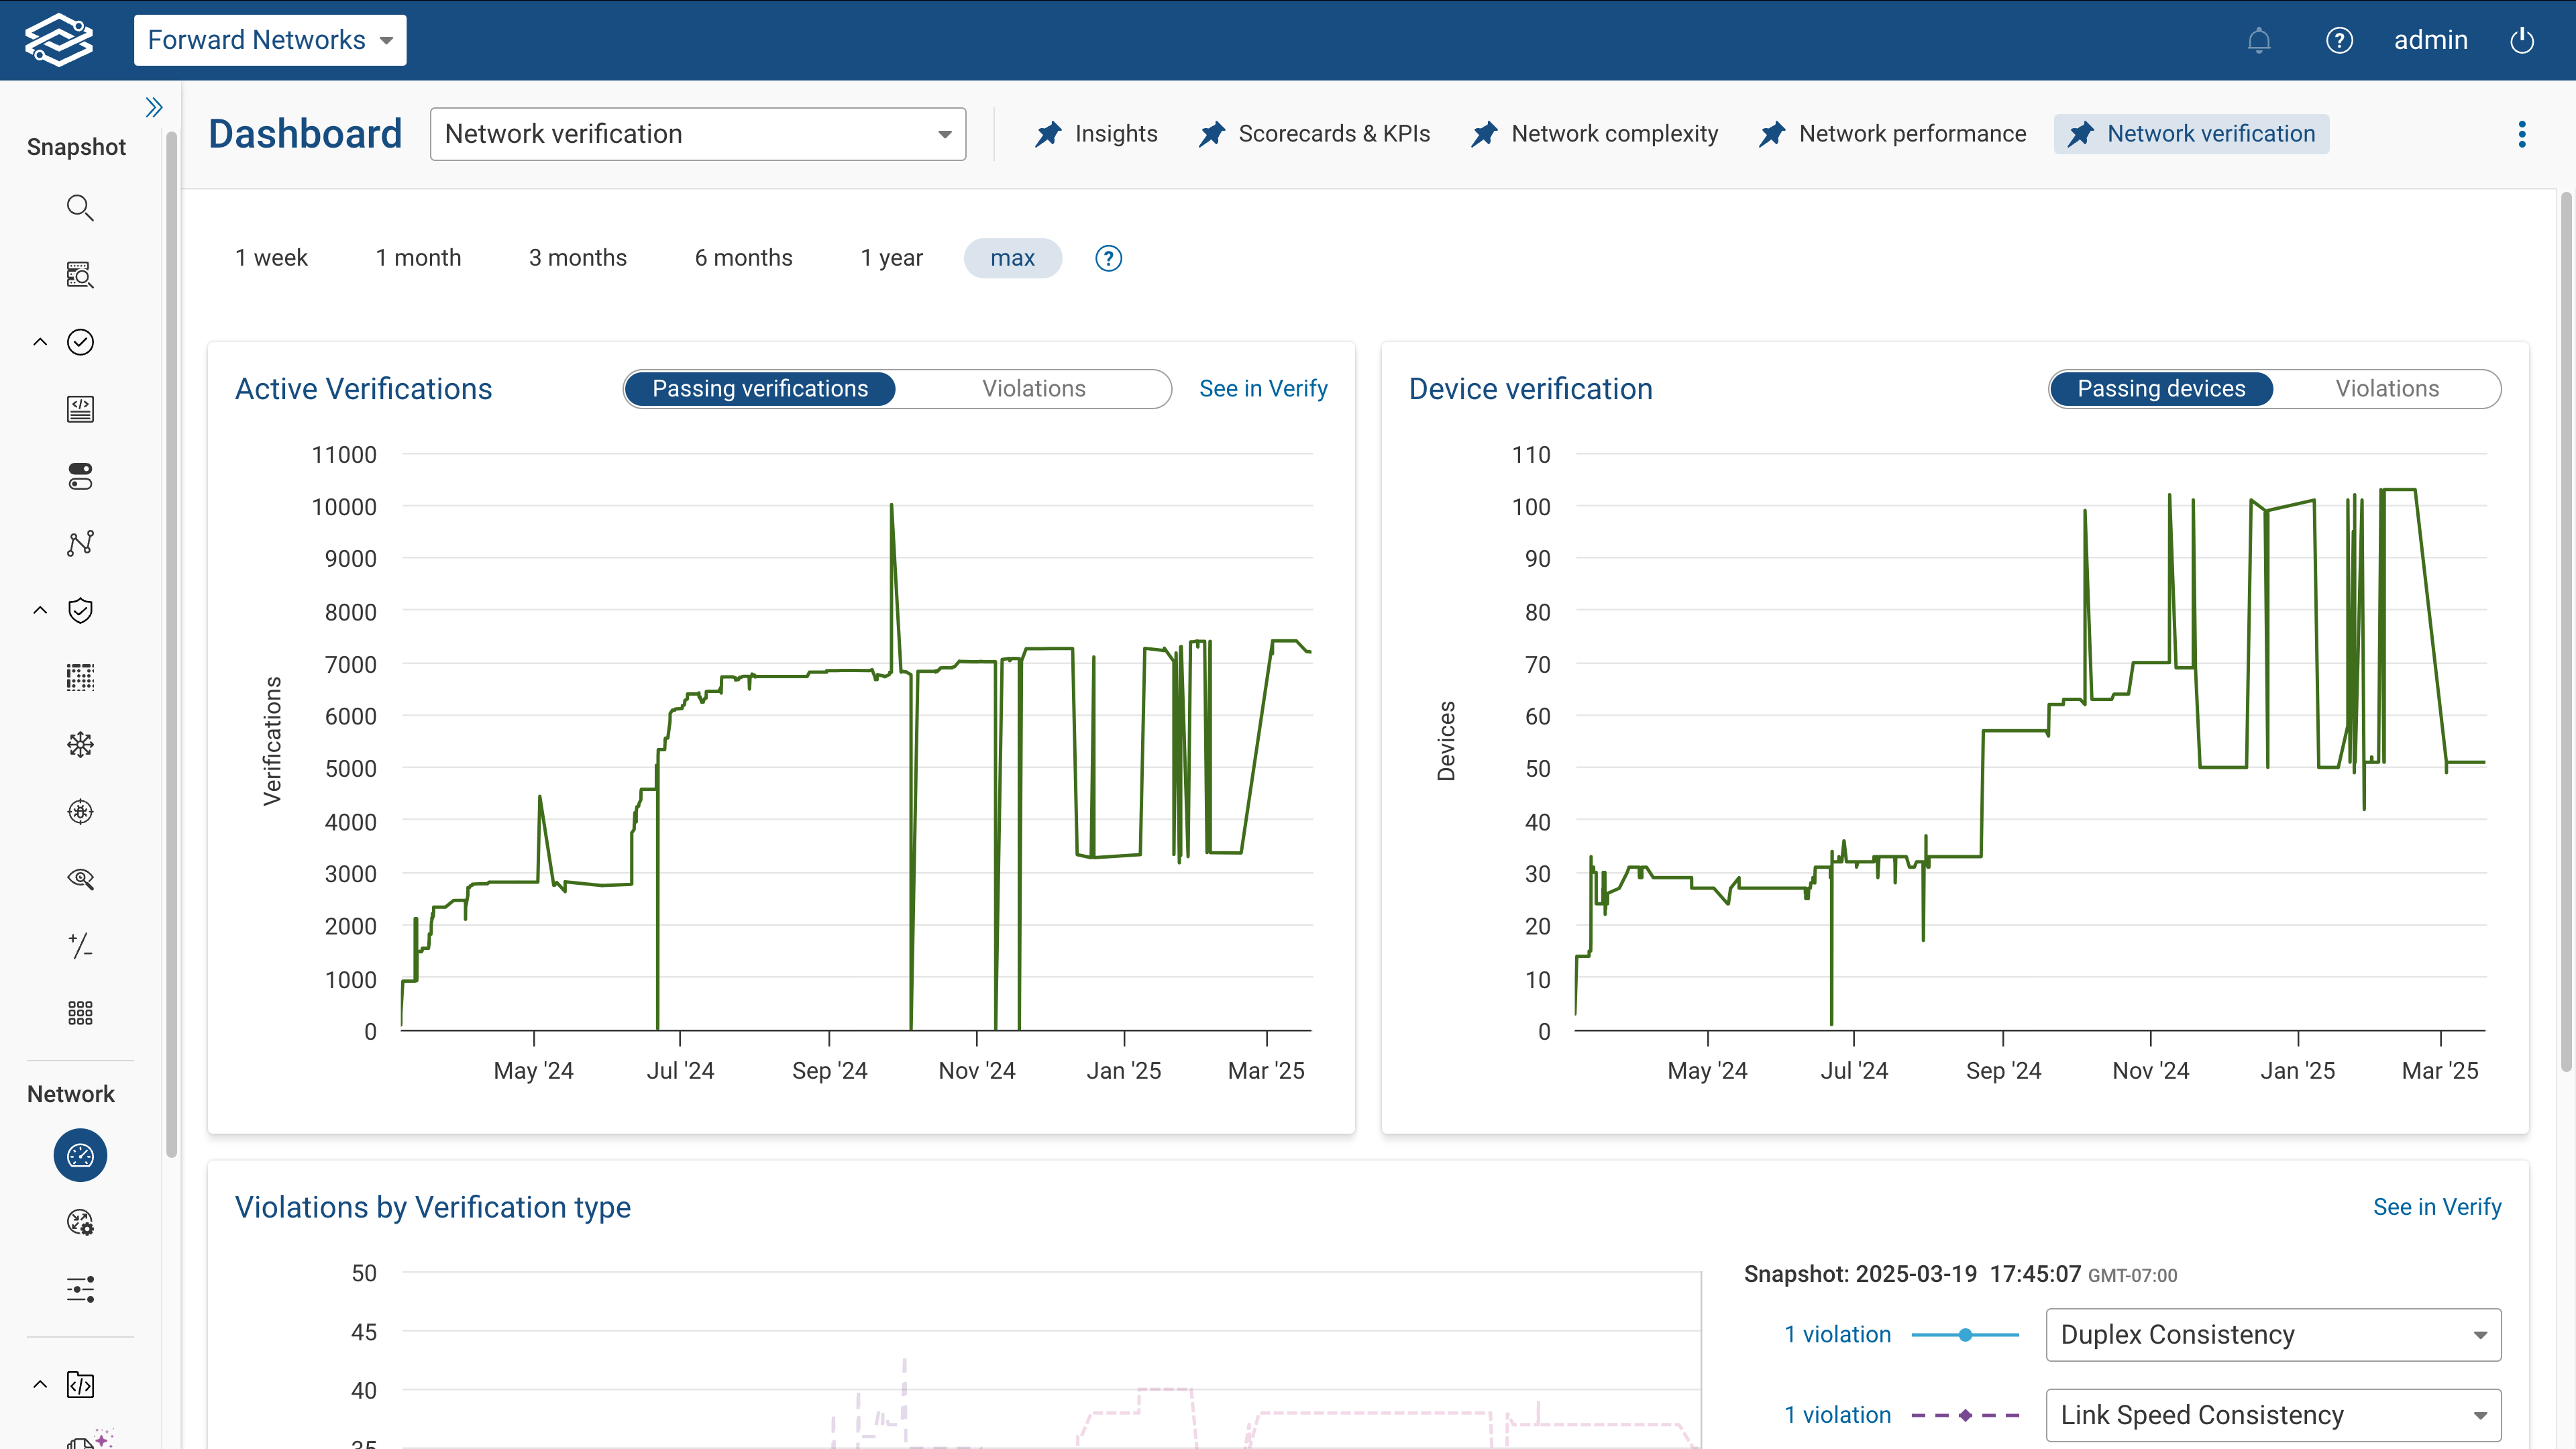
Hovering over a line chart will display more details on a specific insight, as well as useful links for further investigation. The passing verifications line chart within active checks shows the total number of active checks that are passing and categorizes each check as: predefined, intent, or NQE. This will include a direct link to the related section within the verify application.
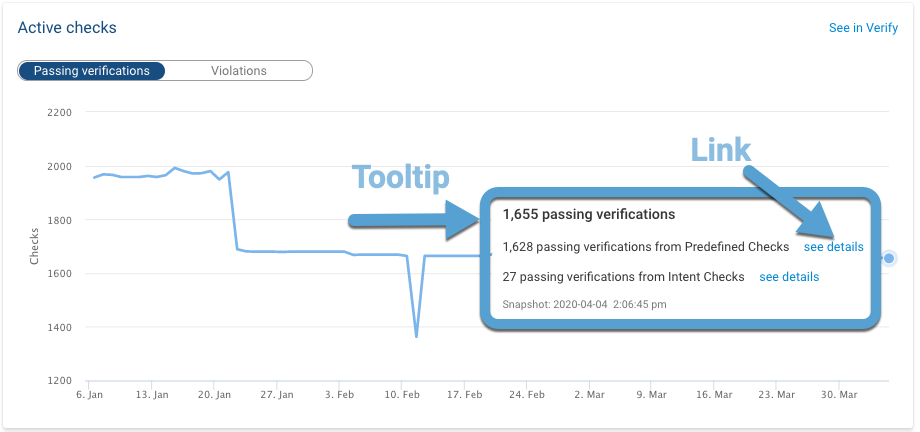
The Violations by check type chart can be customized by selecting specific Predefined or NQE checks in the drop-down menus on the right side of the chart. The selection is persistent for each network across sessions on a per-user basis.
System
The System dashboard provides insights on Collection results and time taken per Snapshot, and Collection times of devices per Snapshot.
Collection results and time taken per Snapshot
The collection and time details are reflective on hovering over the timeline.
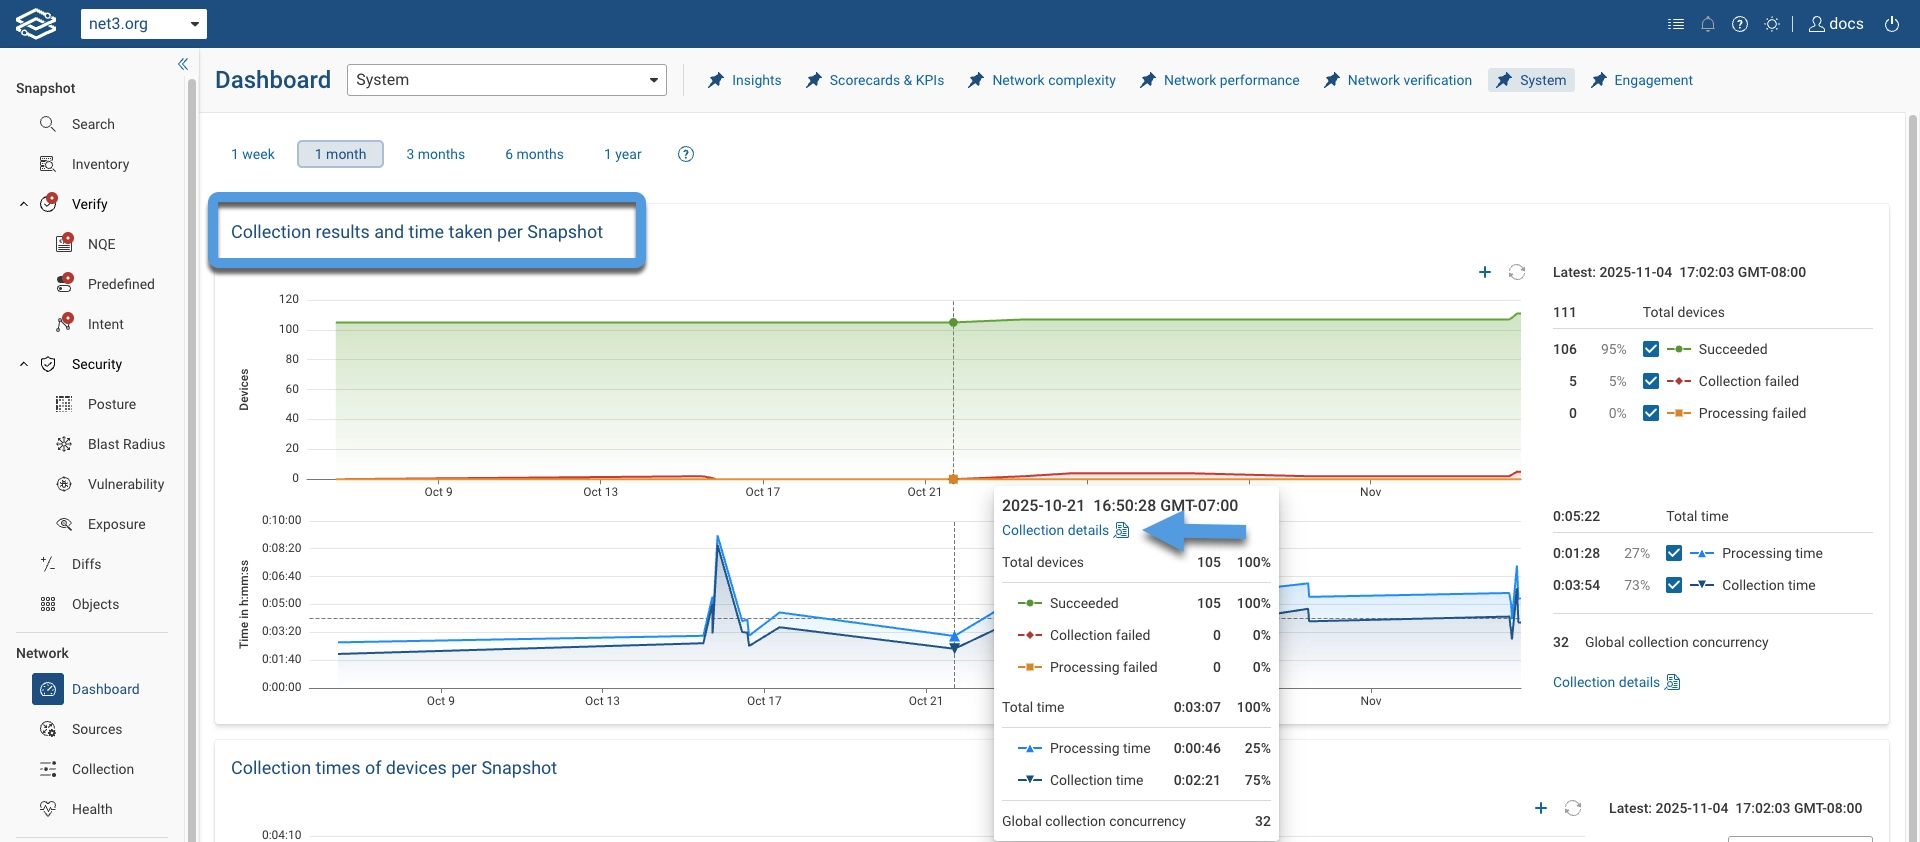
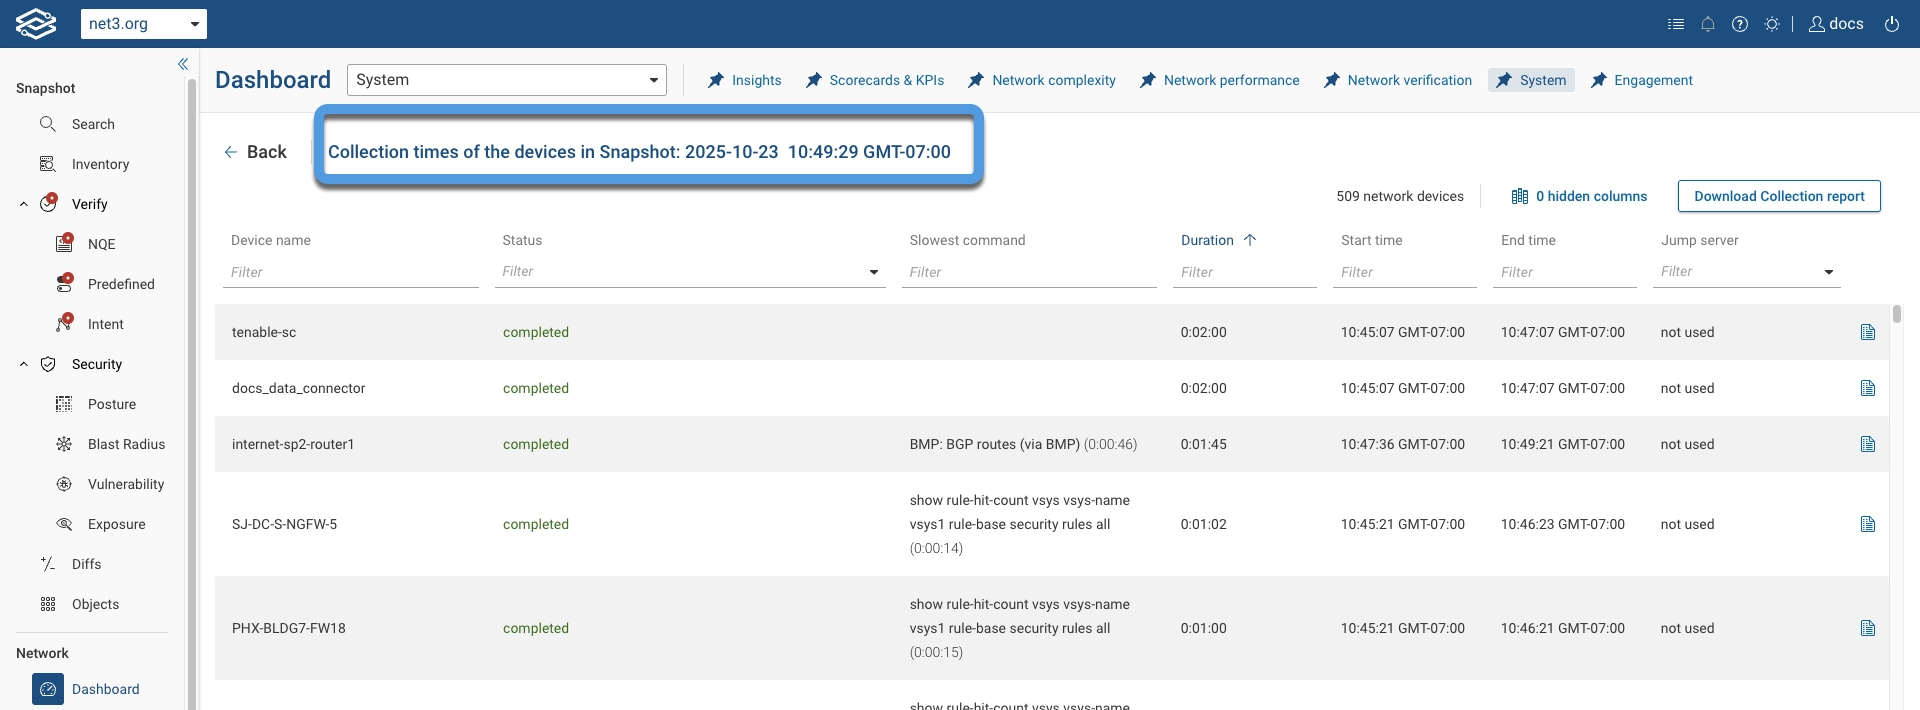
To view detailed device collection times for a Snapshot, hover over the timeline and click Collection details.
The following screenshot shows an example of the detailed view:
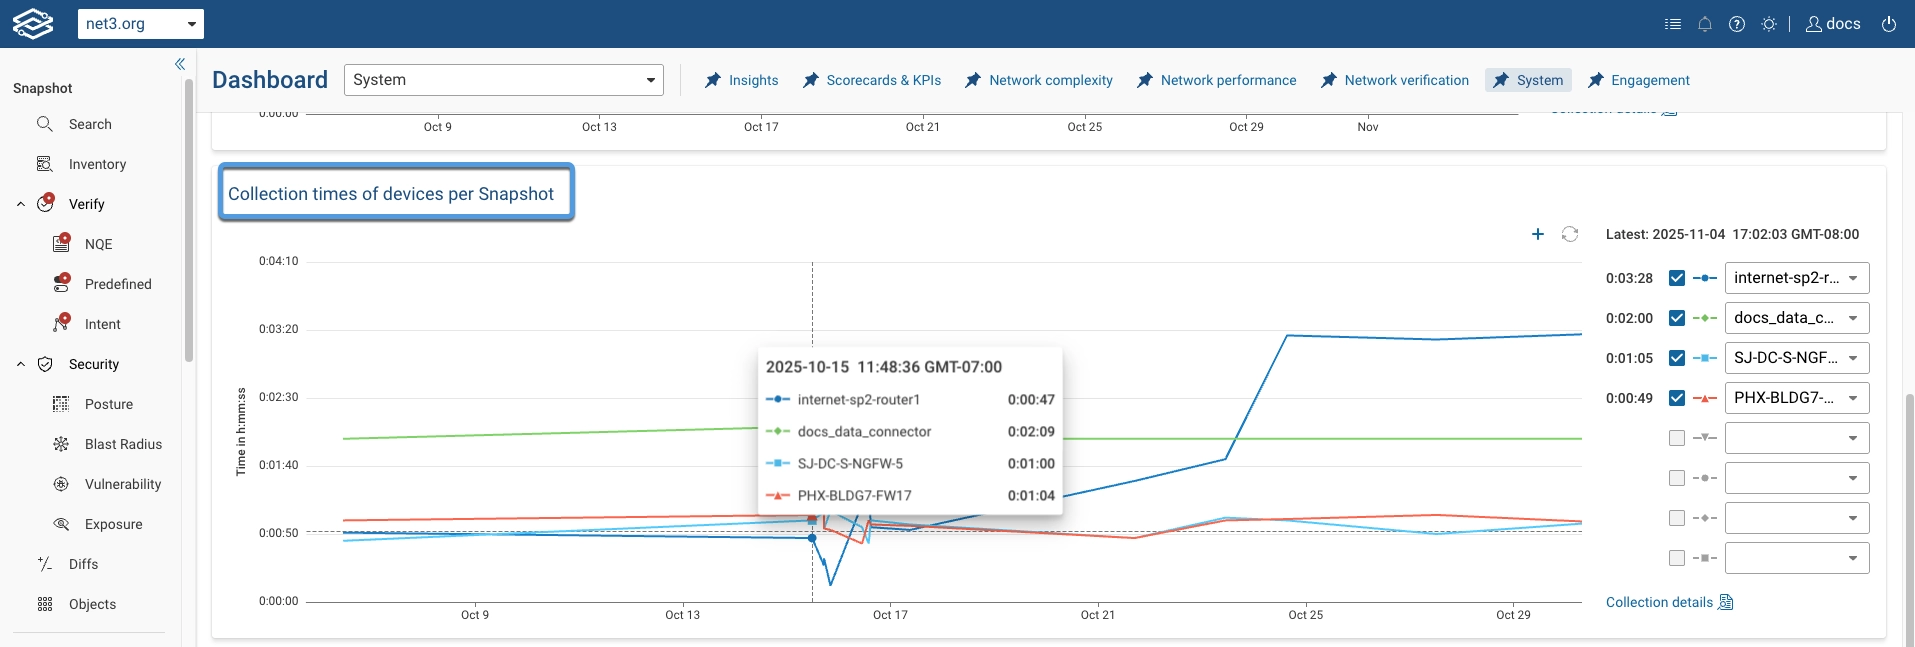
Collection Times of Devices per Snapshot
The collection time details are reflective on hovering over the timeline.
Engagement
The Engagement Dashboard provides deeper visibility into how different user groups interact with the platform. It highlights variations in platform utilization by distinguishing between users or tools that rely heavily on API-based automation and integrations and those that primarily use the UI for hands-on analysis.
The dashboard provides a set of granular, segmented reports that analyze user activity across multiple dimensions, providing clear operational insights.
These reports deliver actionable metrics that help administrators and team leaders:
- Optimize resource allocation
- Identify training opportunities
- Improve platform adoption based on team workflows and skill sets.
The dashboard can be viewed using Daily, Weekly, Monthly, or Custom trend within a selected time range (e.g., Past week, Past month, etc.).
UI
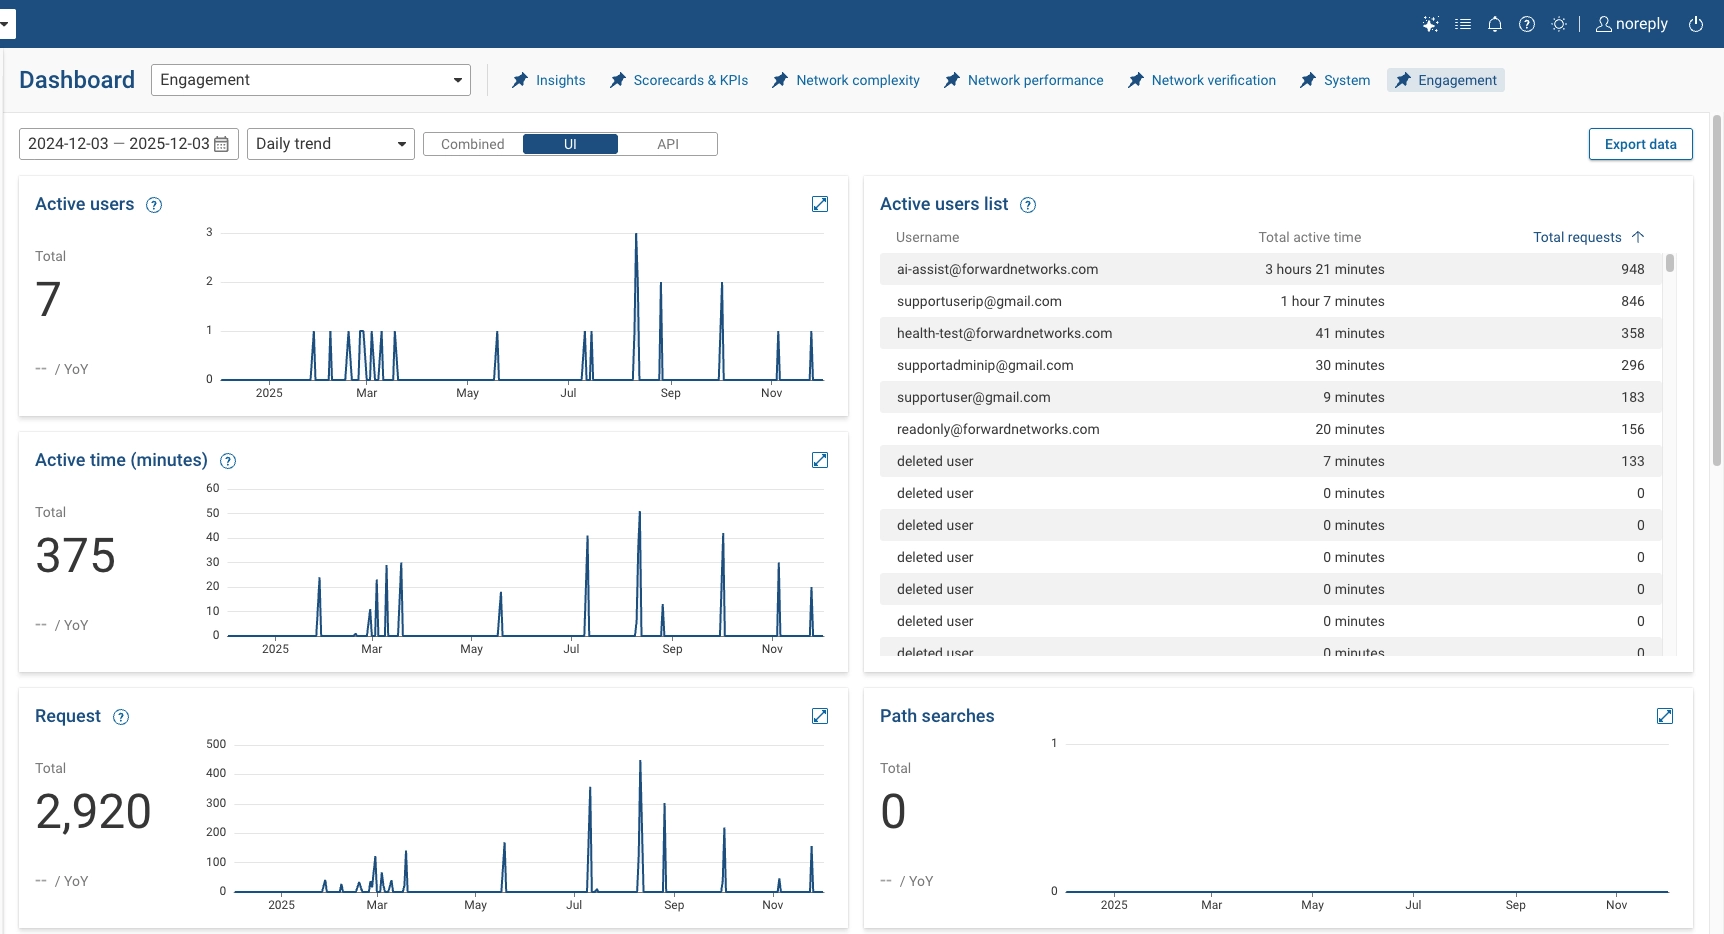
The UI view provides engaments insights over a set interval of time:
- Active users - Distinct users who made at least 2 UI-originated backend requests within any rolling 30-minute window.
- Active user list - List of all active users, and total time of activity.
- Active time (minutes) - Total activity time of all users on the platform.
- Request - Number of backend requests received from the UI. A single page view can trigger multiple backend requests. Browser asset loads are excluded. Retries are included once per unique request id. Includes success and error responses.
- Path searches - Total number of path searches issued.
- Text searches - Total number of text searches issued.
- NQE interactions- Total number of NQE interactions.
- NQE tutorial progress - List of the most active users for the NQE tutorial and the number of lessons each user has completed.
- NQE query executions - Total number of NQE quries executed.
- Collected file views - Total number of collected file views.
- Inventory views - Total number of inventory views.
- Diff views - Total number of diff views issued.
- Blast radius views - Total number of blast radius views.
- CVE views - Total number of CVE views.
- Exposure analysis views - Total number of CVE views.
- Security matrix views - Total number of security matrix views.
- Dashboard views - Total number of dashboard views.
API
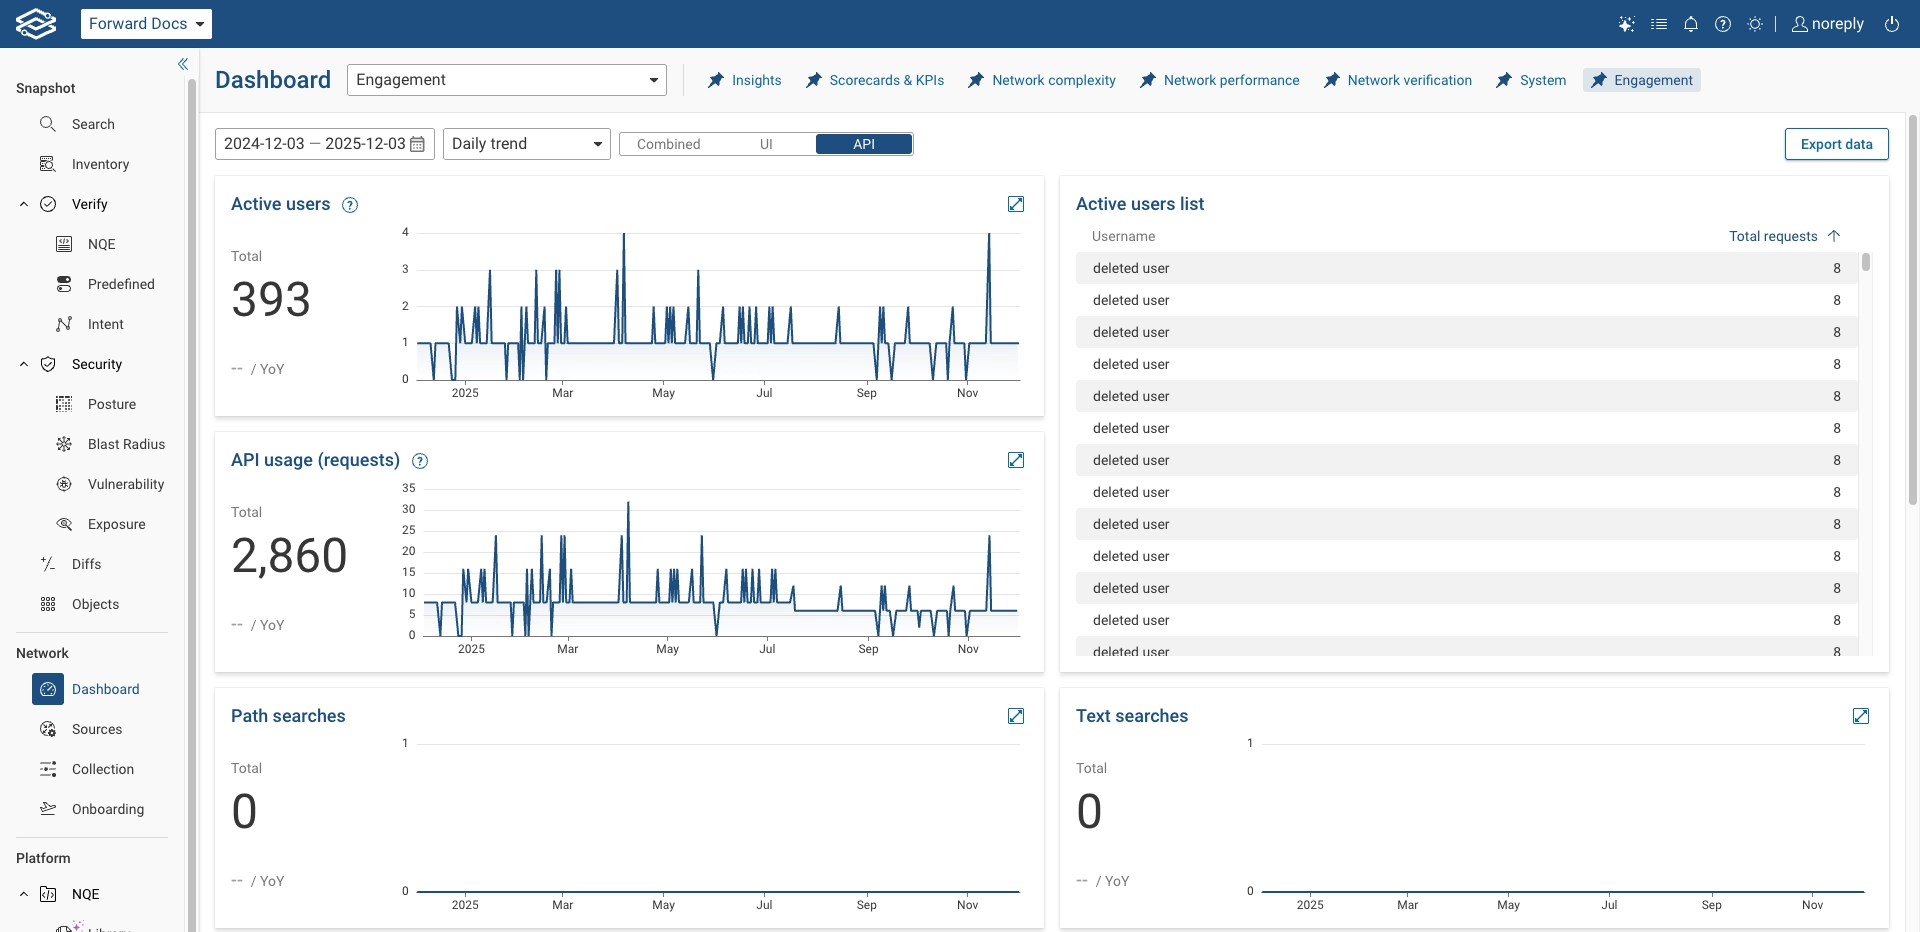
The API view provides engaments insights over a set interval of time:
- Active users - Distinct people who made at least 2 direct API requests within any rolling 30-minute window. Multiple tokens from the same owner are deduplicated.
- Active user list - Top users during the selected period.
- Requests = total backend requests attributed to the user.
- Active minutes = sum of session durations (if enabled). Users are deduplicated across UI and API.
- API usage (requests) - Number of backend requests received from the API during the selected time period. A single page view can trigger multiple backend requests. Browser asset loads are excluded. Retries are included once per unique request id. Includes also success and error responses.
- Path searches - Total number of path searches issued.
- Text searches - Total number of text searches issued.
- NQE interactions- Total number of NQE interactions.
- NQE tutorial progress - List of the most active users for the NQE tutorial and the number of lessons each user has completed.
- NQE query executions - Total number of NQE quries executed.
- Collected file requests - Total number of collected file requests.
- Inventory requests - Total number of inventory requests.
- Diff requests - Total number of diff requests issued.
- Blast radius requests - Total number of blast radius requests.
- CVE requests - Total number of CVE requests.
- Exposure analysis requests - Total number of exposure analysis requests.
- Security matrix requests - Total number of security matrix requests.
- Dashboard requests - Total number of dashboard requests.
Combined
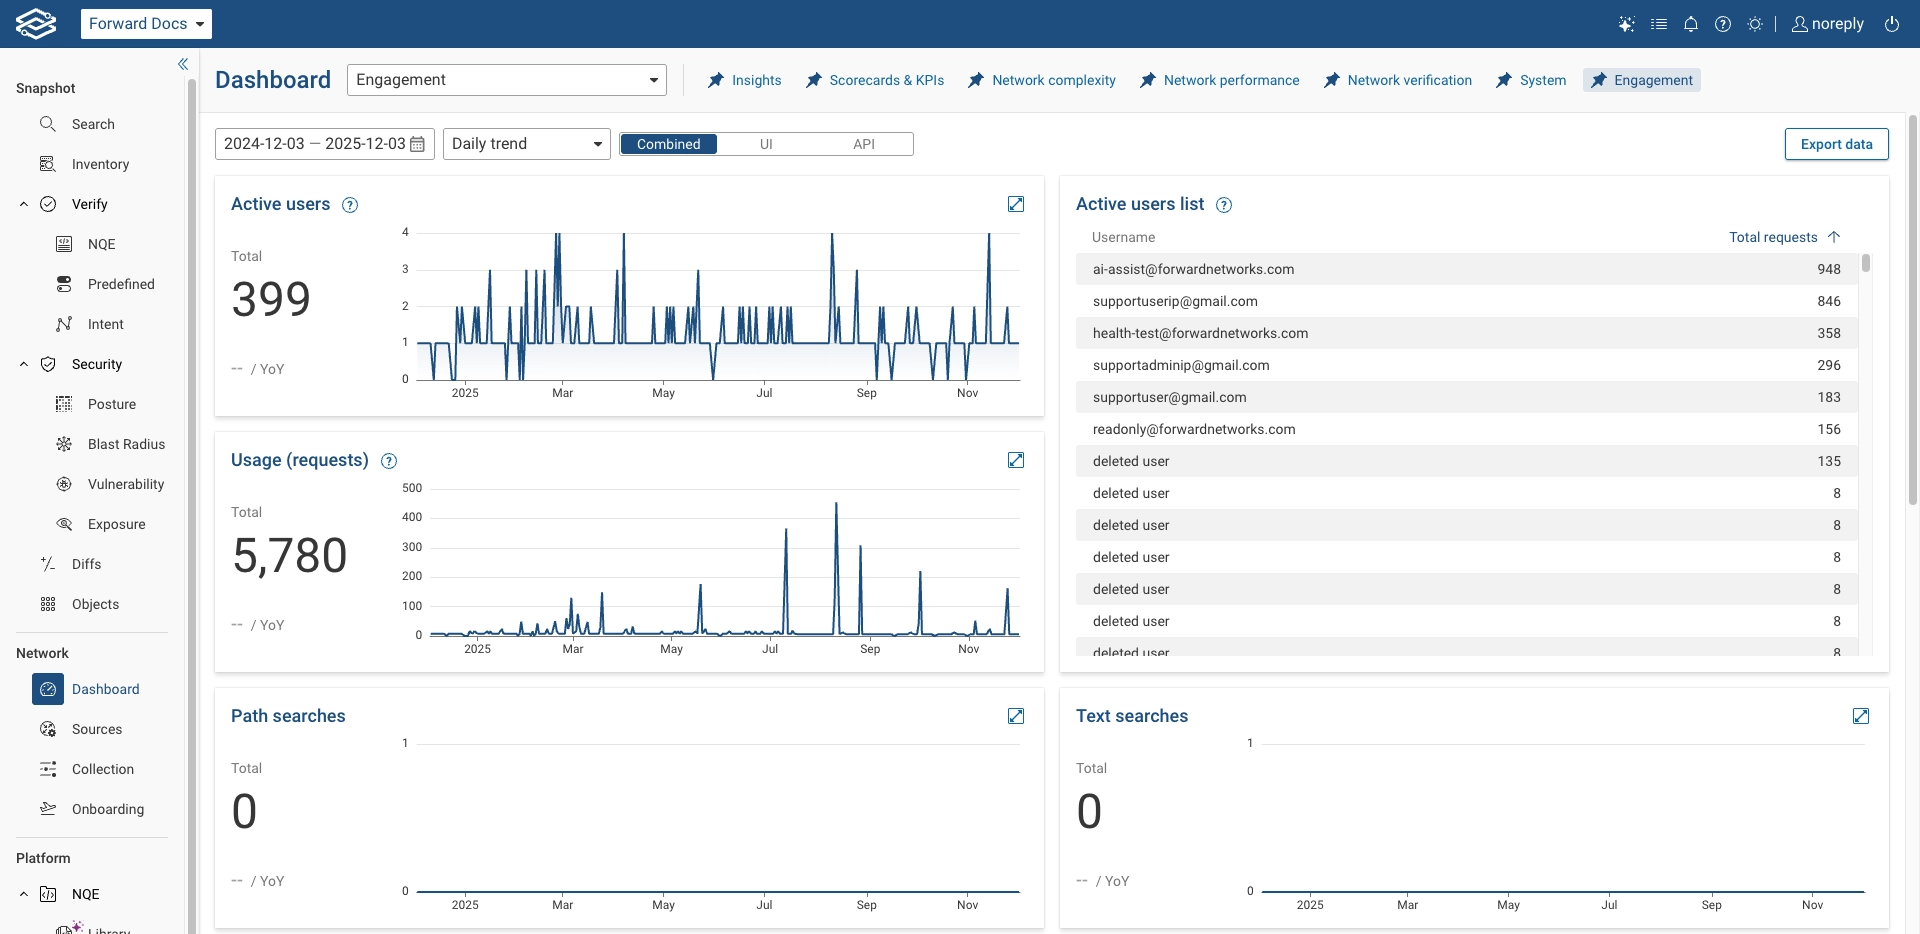
The Combined view provides engaments insights from UI and APIs over a set interval of time:
- Active users - Distinct people who made at least 2 backend requests within any rolling 30-minute window in the UI or API. API tokens are attributed to their owner; if a person is active in both channels within the same window, they count once.
- Active users list - Top users during the selected period. Requests shows each user's total requests across both channels for the selected period. Users are deduplicated across UI and API.
- Usage (requests) - Number of backend requests received from the UI or API. A single page view can trigger multiple backend requests. Browser asset loads are excluded. Retries are included once per unique request id. Includes also success and error responses.
- Path searches - Total number of path searches issued.
- Text searches - Total number of text searches issued.
- NQE interactions- Total number of NQE interactions.
- NQE tutorial progress - List of the most active users for the NQE tutorial and the number of lessons each user has completed.
- NQE query executions - Total number of NQE quries executed.
- Collected file requests - Total number of collected file requests.
- Inventory requests - Total number of inventory requests.
- Diff requests - Total number of diff requests issued.
- Blast radius requests - Total number of blast radius requests.
- CVE requests - Total number of CVE requests.
- Exposure analysis requests - Total number of exposure analysis requests.
- Security matrix requests - Total number of security matrix requests.
- Dashboard requests - Total number of dashboard requests.
Exporting Engagement Data
Organization Admins can export engagement statistics based on their specific needs, allowing them to retrieve the exact data required for reporting, analysis, or integration with external systems.
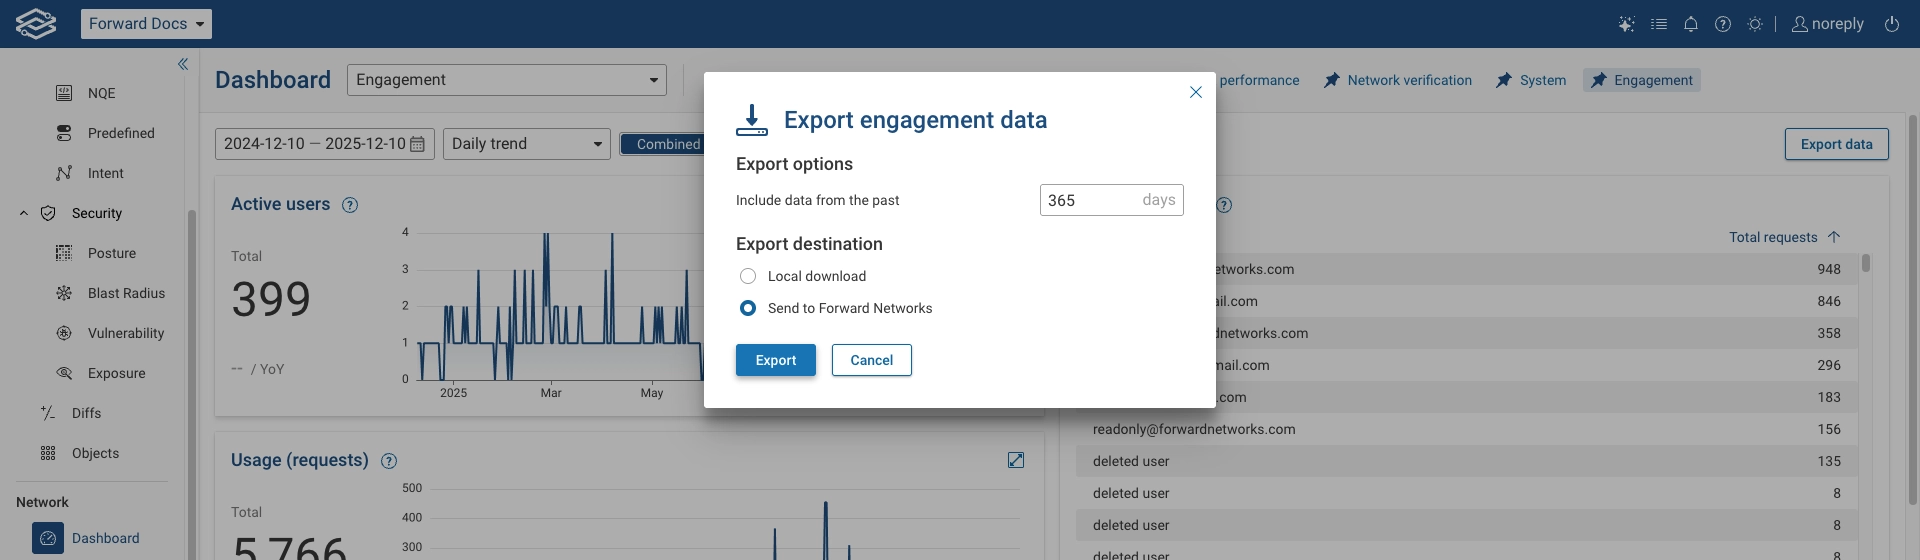
To export engagement data:
- Select Export data.
- Specify the desired date range by indicating the number of days to include in the export. Data is retained for up to 15 months.
- Select Export destination option:
- Local Download - Local download of a ZIP file containing several reports in CSV format
- Send it to Forward Networks - Sends the report to the Forward support team
- Click Export.