Performance Data
Forward Enterprise uses SNMP to periodically poll network devices, gathering utilization statistics such as CPU and memory usage, along with interface statistics. These metrics help identify potential bottlenecks in network performance. The results are available via the search application to view the statistics in the context of a path search or in the device card in case of device CPU and memory utilization. Historical data views are also available to track performance metrics over time.
Configuration
Only Network admins (and Org admins) can configure these settings, which are on a per-network level.
Enabling performance data collection
Users can choose which devices to see performance data. Forward Enterprise collects this data using SNMP.
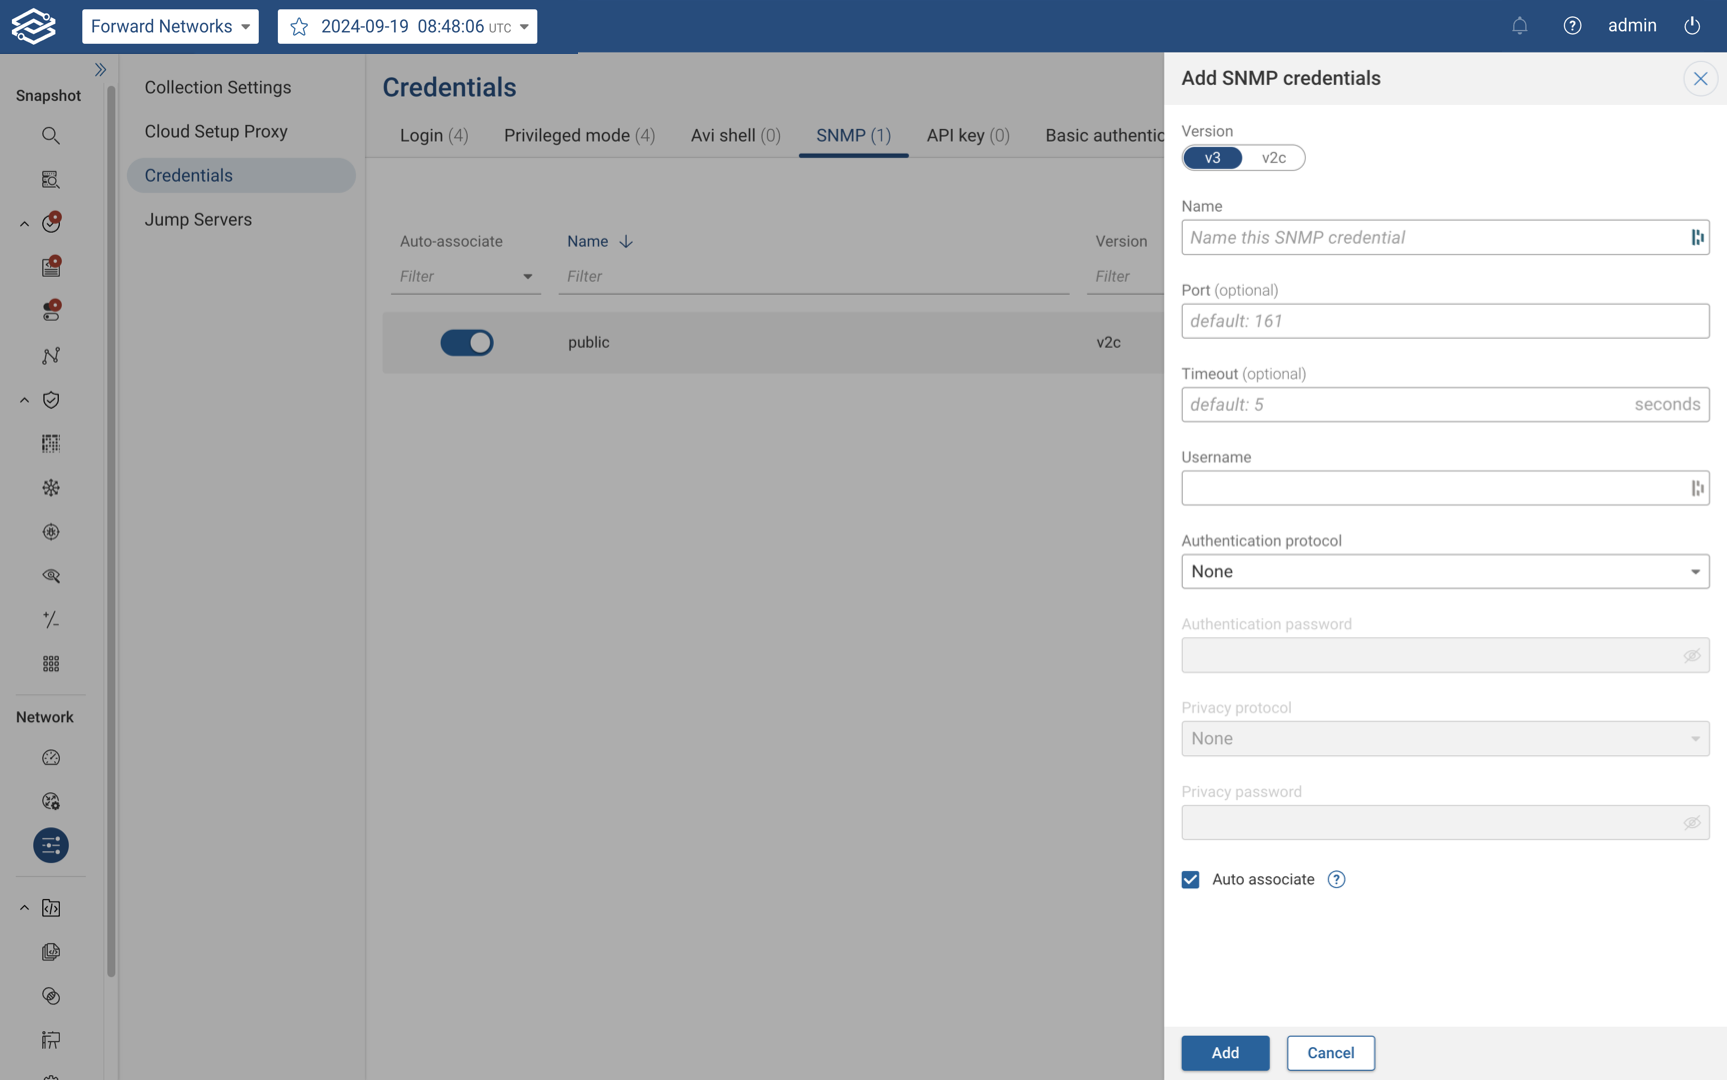
Step 1: Add SNMP credentials
Before SNMP collection can be enabled, appropriate SNMP credentials must be added:
- Navigate to Collection > Credentials.
- Under the SNMP tab, add SNMP v2c or SNMP v3 credentials as required.
Step 2: Configuring SNMP collection for devices
Once SNMP credentials are added, follow these steps to enable performance data collection:
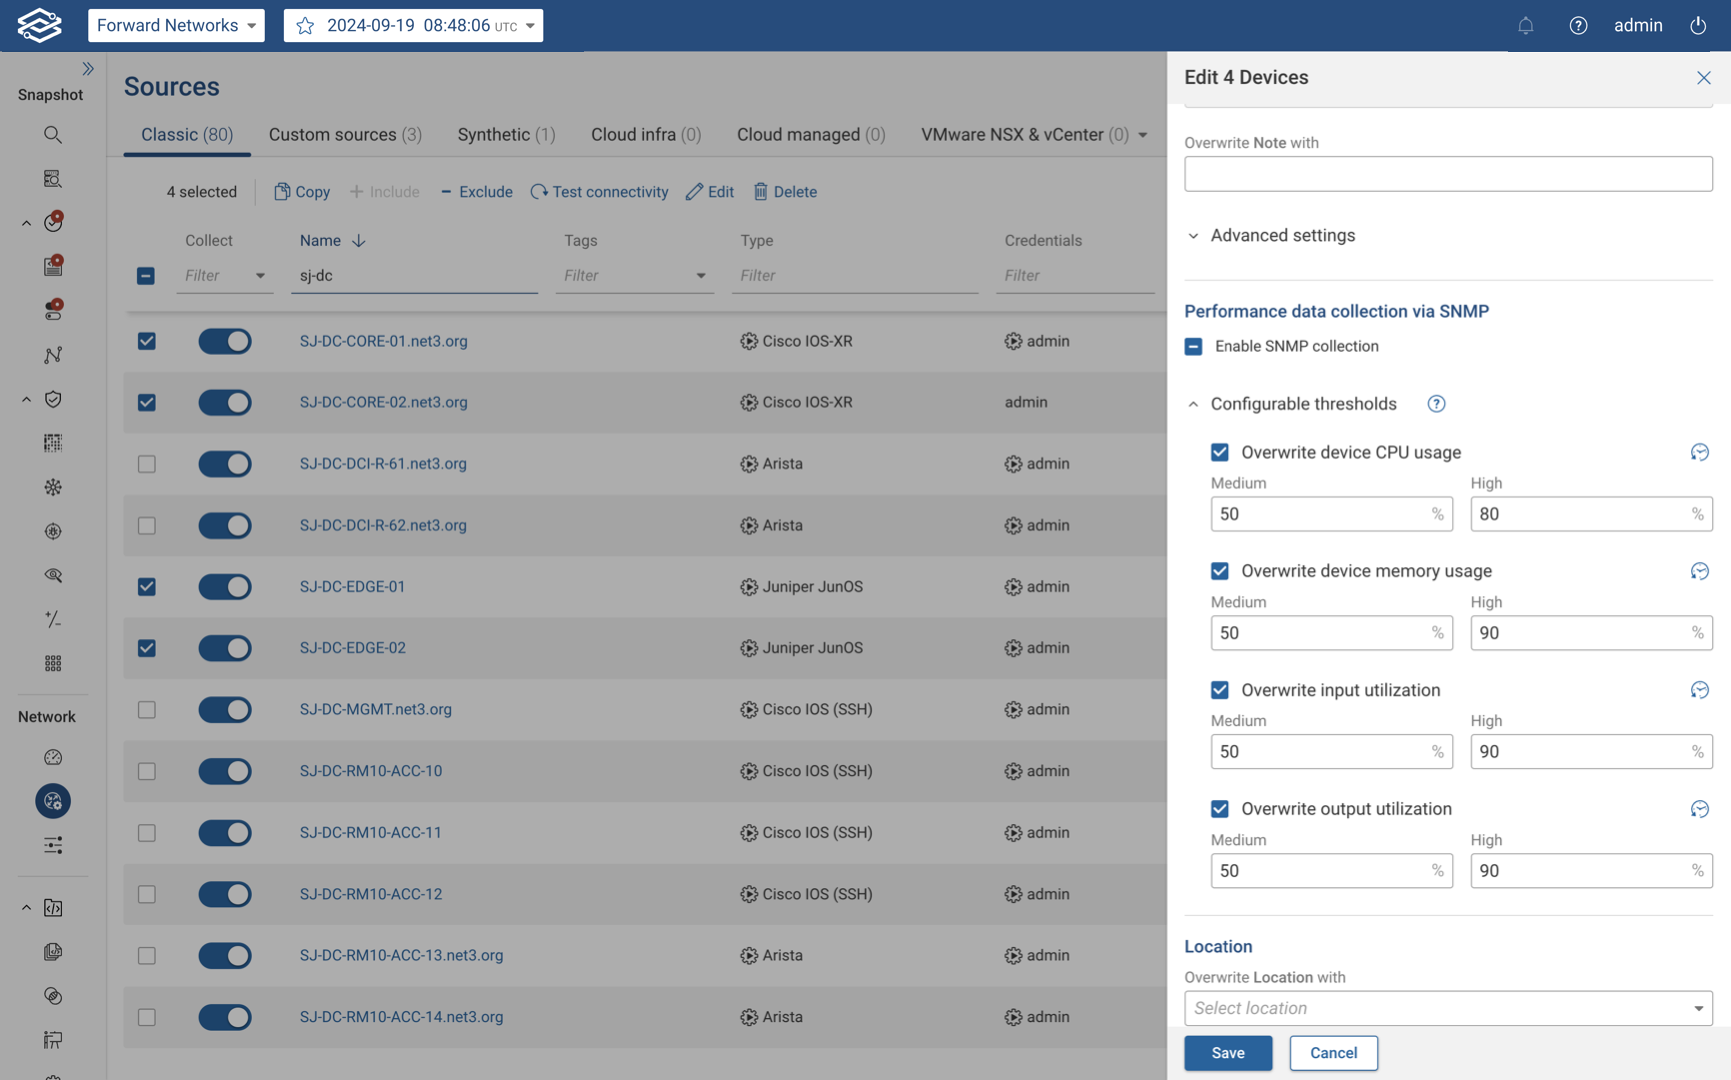
- Navigate to Sources > Classic.
- Select the device(s) for which you want to enable SNMP collection.
- For a single device: Click the edit icon next to the device at the end of the row.
- For multiple devices: Select the checkboxes next to the devices to configure and click Edit at the top of the screen.
- In the Performance Data Collection via SNMP section, enable SNMP collection, and expand Configurable Thresholds.
- Set the desired thresholds for each metric:
- Device CPU Usage:
- If configuring multiple devices, select Overwrite Device CPU Usage to configure the selected devices.
- Medium (optional): Can be set between 50% and the high threshold.
- High: Must be set between 75% (or medium threshold if higher) and 100%. (Default: 80%)
- Device Memory Usage:
- If configuring multiple devices, select Overwrite Device Memory Usage to configure the selected devices.
- Medium (optional): Can be set between 50% and the high threshold.
- High: Must be set between 75% (or medium threshold if higher) and 100%. (Default: 90%)
- Input Utilization:
- If configuring multiple devices, select Overwrite Input Utilization to configure the selected devices.
- Medium (optional): Can be set between 50% and the high threshold.
- High: Must be set between 75% (or medium threshold if higher) and 100%. (Default: 90%)
- Output Utilization:
- If configuring multiple devices, select Overwrite Output Utilization to configure the selected devices.
- Medium (optional): Can be set between 50% and the high threshold.
- High: Must be set between 75% (or medium threshold if higher) and 100%. (Default: 90%)
- Device CPU Usage:
- Reset All to Default: Selecting this will reset all SNMP thresholds to default values for the selected devices.
- The device collection toggle should be enabled to ensure that performance data collection takes place.
- Please ensure that the device type is known either by running a connectivity test or by assigning a device type manually before collecting performance and health data.
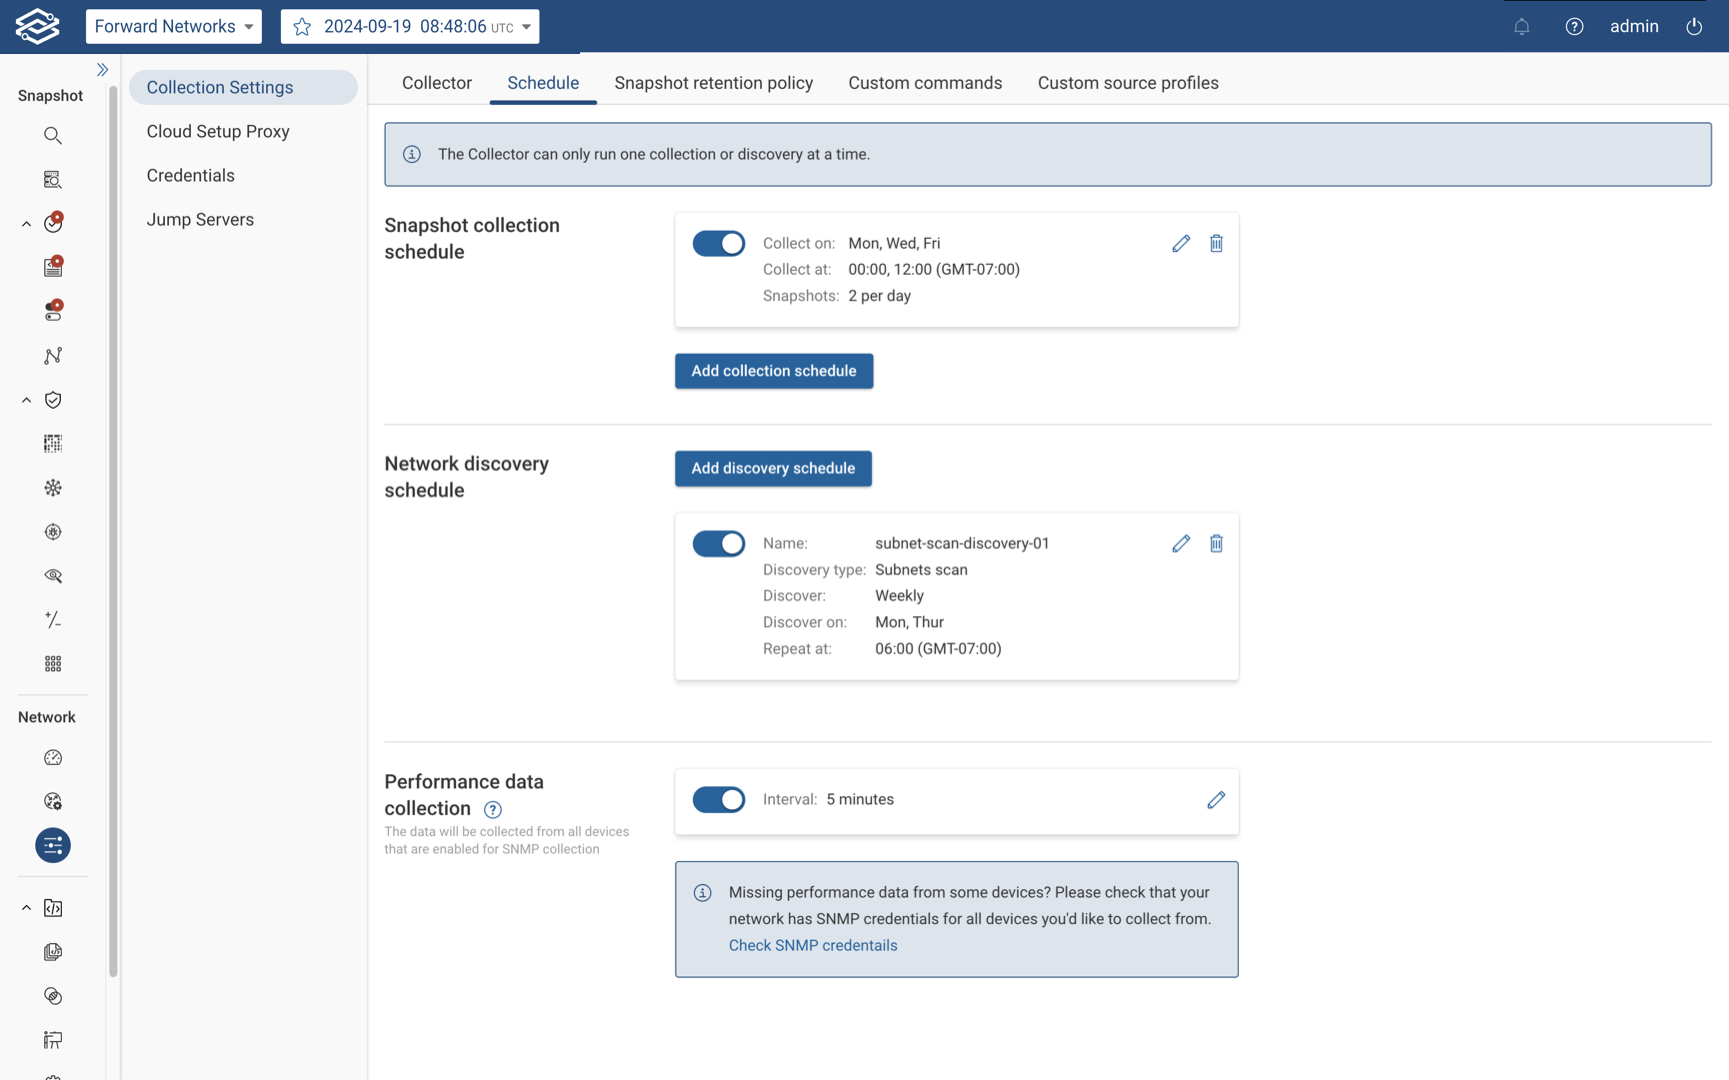
Step 3: Configuring the collection schedule
- Navigate to Collection > Schedule.
- Enable Performance data collection. By default, the collection interval is set to 5 minutes. To change the time interval between collections, click the edit icon, input the amount of time in minutes, and save the changes.
Performance data will now be collected from all devices with SNMP collection enabled.
Performance data collection settings are not copied to workspace networks, so it’s disabled by default for workspace networks, just as it is for regular networks. Performance data collection is supported for workspace networks.
Health and performance data
Once collection is enabled, the Forward platform collects the following data via SNMP polling:
- Device health
- Uptime
- CPU usage
- Memory usage
- Device interface stats
- Input Utilization
- Input errors
- Output Utilization
- Output errors
- Input discards
- Output discards
View device health and performance
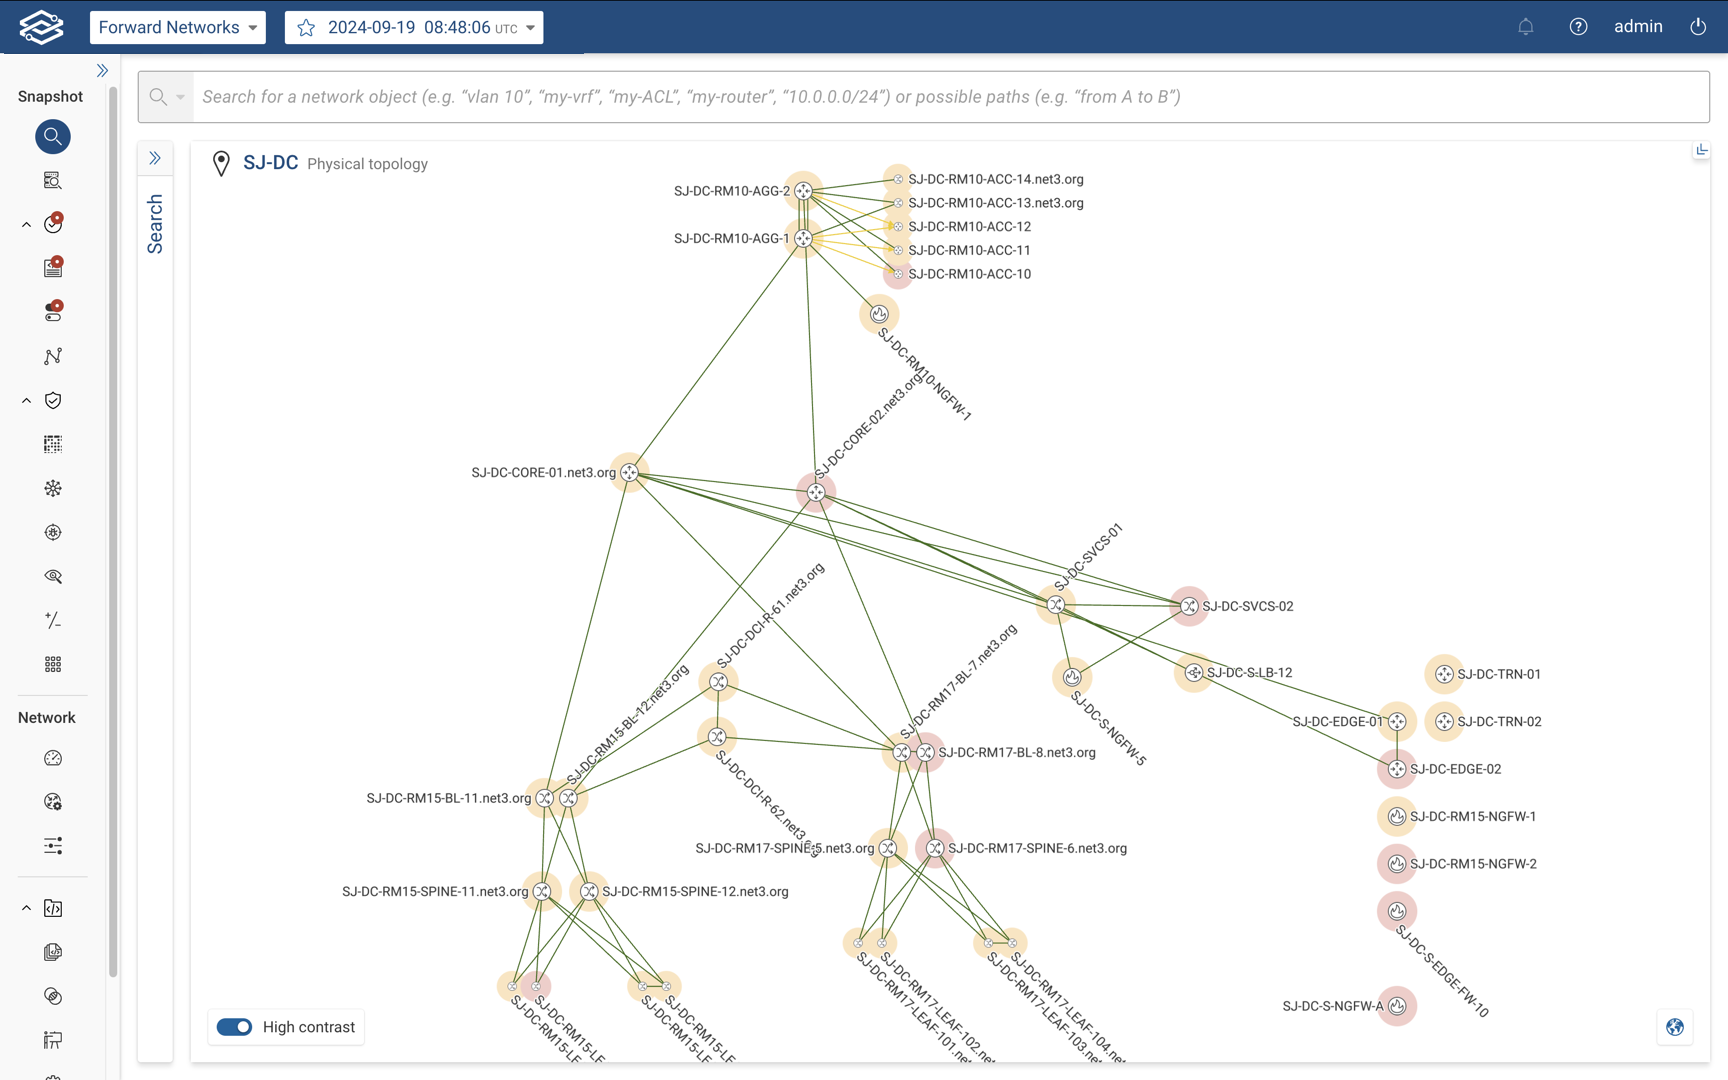
After SNMP thresholds are configured, Forward collects health and performance data, which are available in the following views: device cards, path analysis, and device interface. Devices or interfaces exceeding thresholds are highlighted in yellow when exceeding medium thresholds and red when exceeding high thresholds.
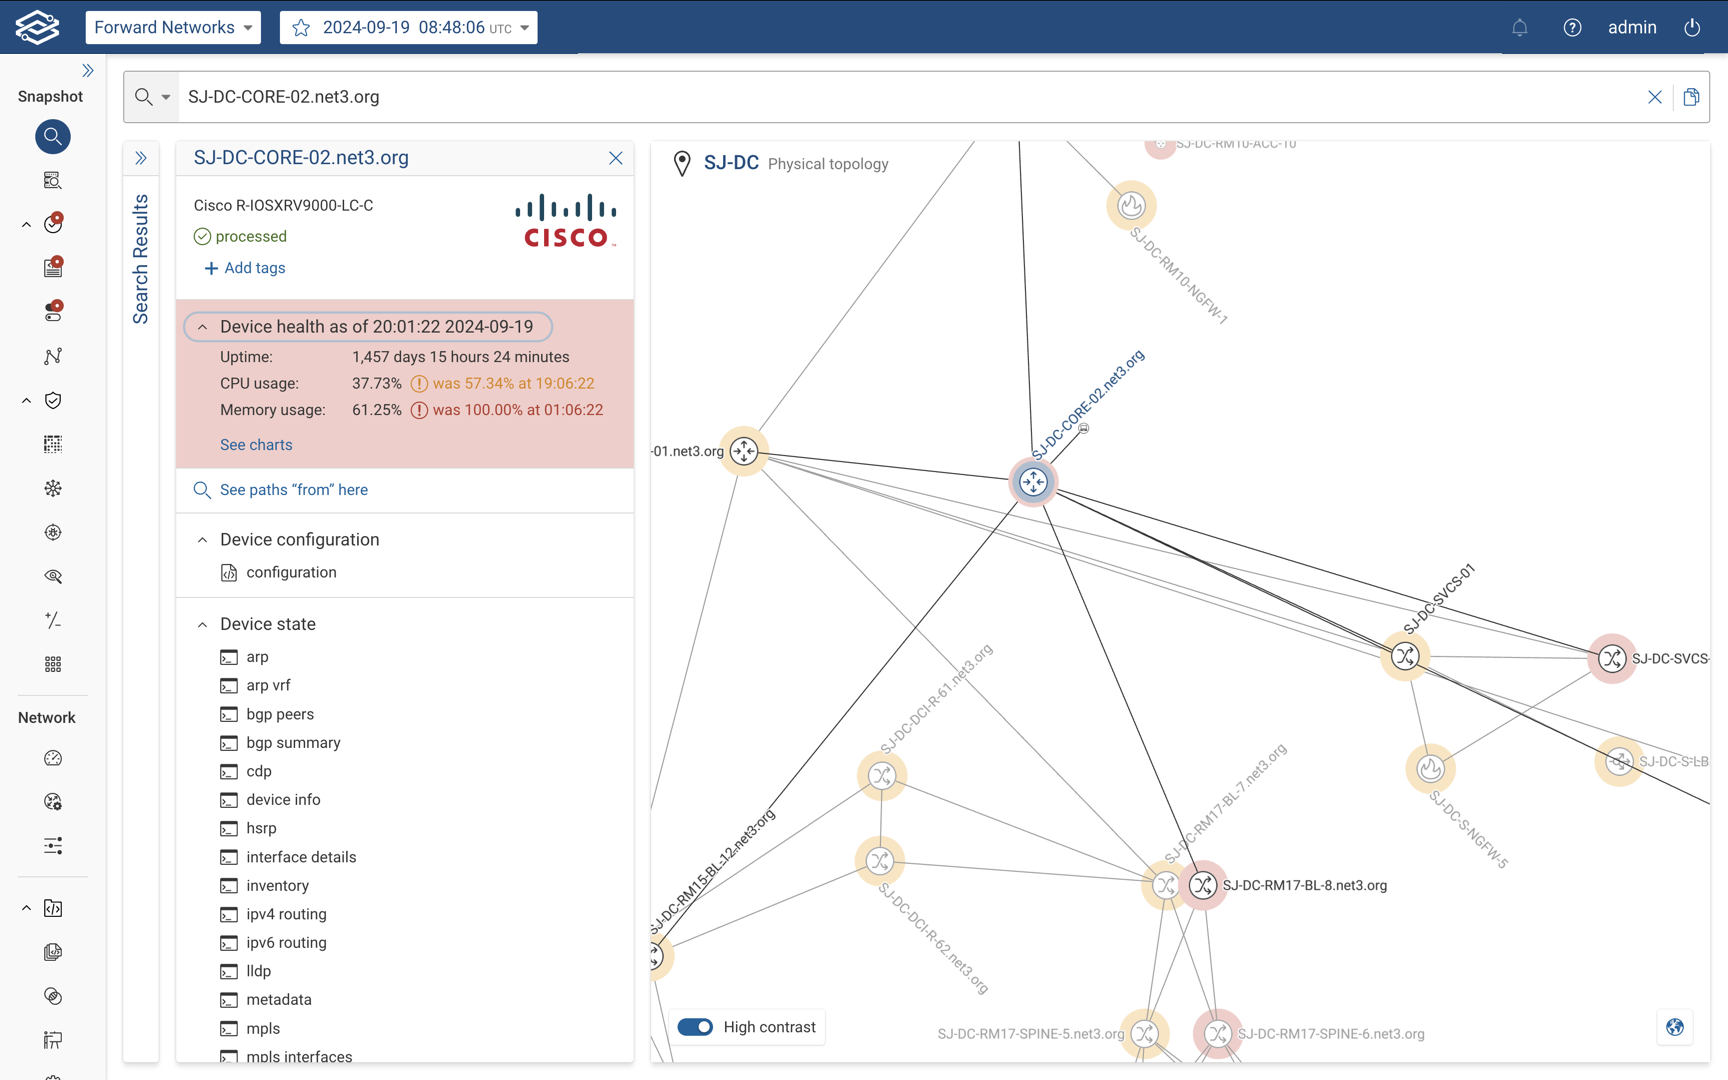
Device cards
When searching for a specific device, the device card displays a section called Device Health. This section shows device uptime, CPU and memory utilization. To visualize the data over time, click See charts.
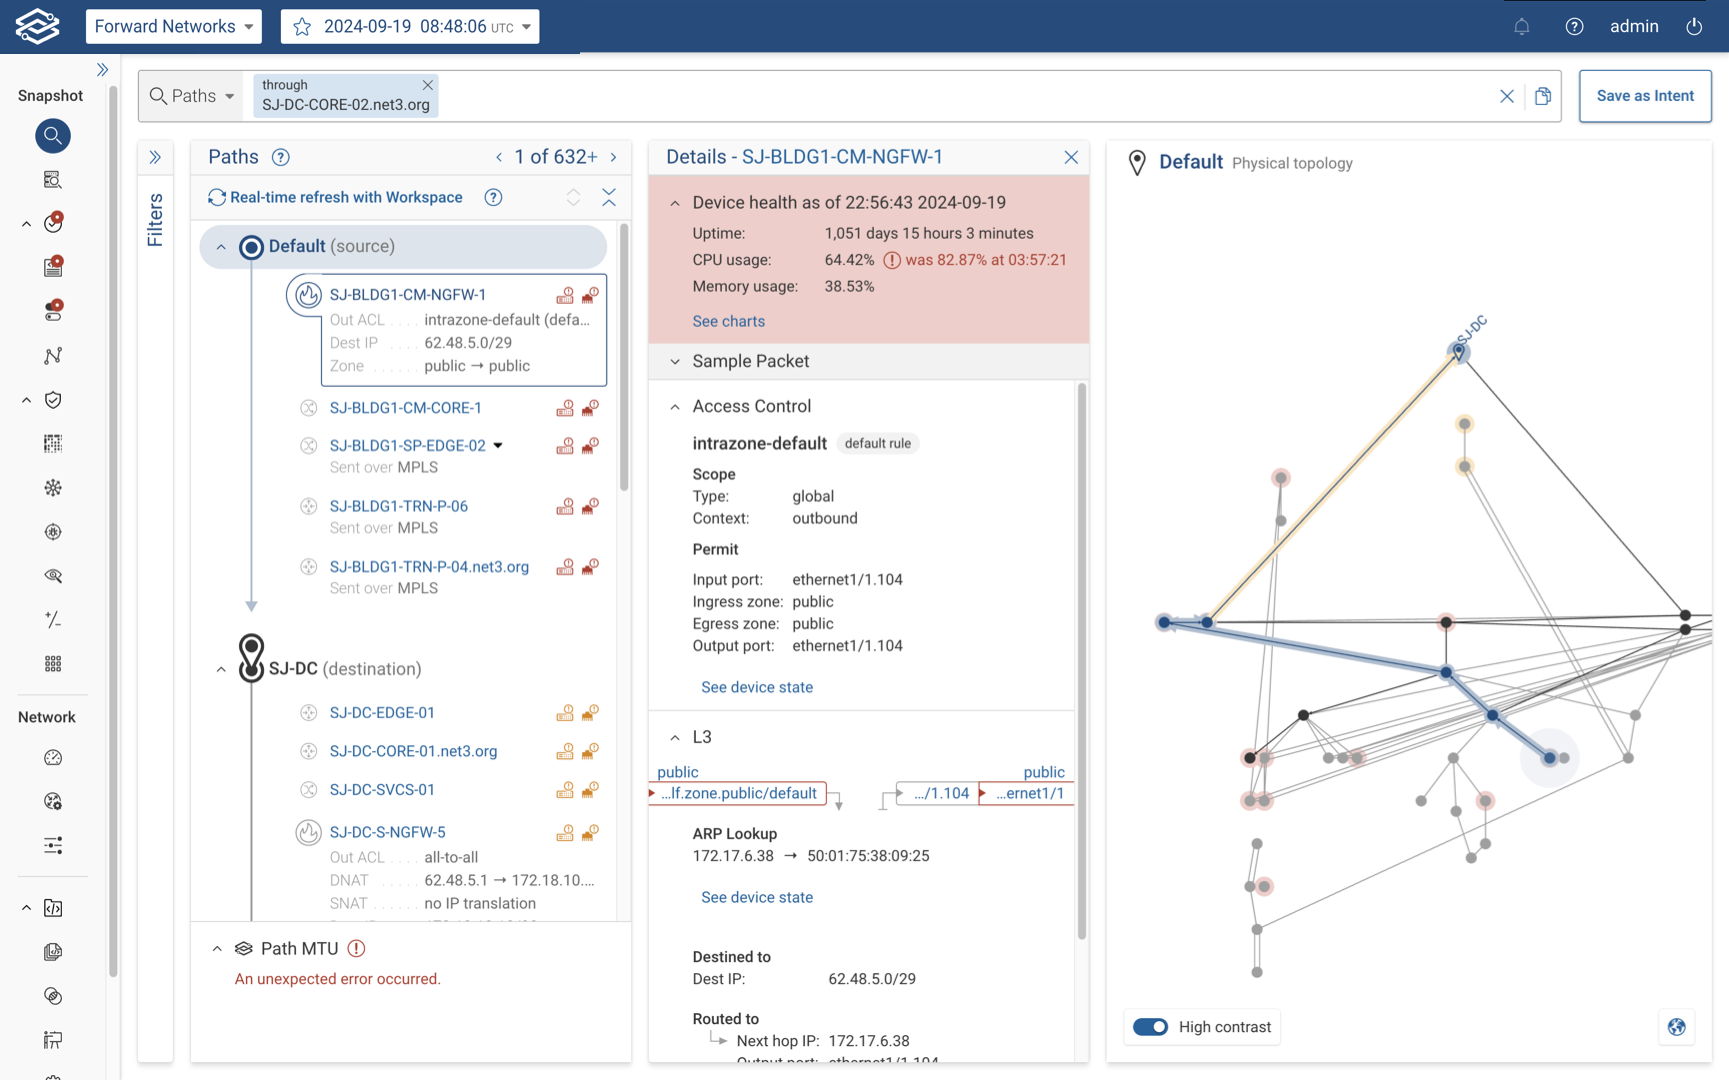
Path analysis
When analyzing a path, clicking on a hop within the path result shows the health and performance data for the selected device and interfaces carrying the flow.
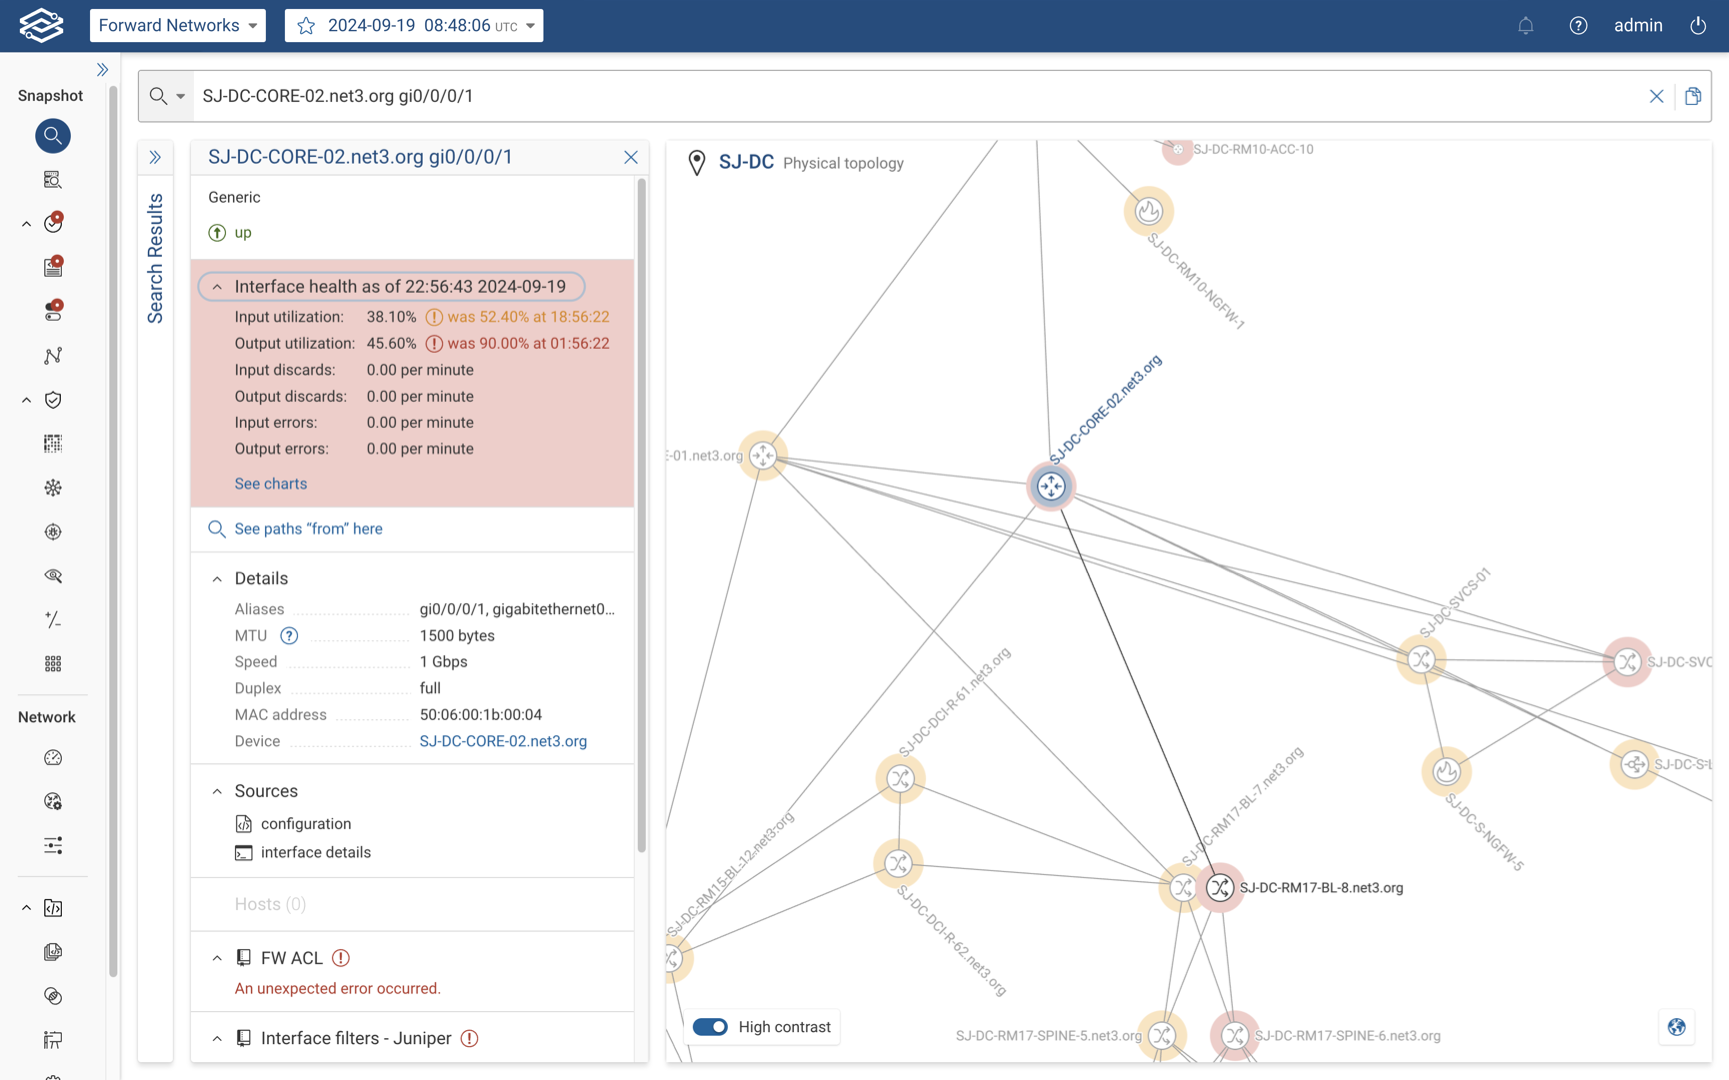
Device interface
Device interface-level performance data can be viewed in the Search application, showing real-time input/output utilizations and errors.