Onboarding
The Onboarding Dashboard is a new, per-network view designed to streamline customer onboarding and ongoing collection troubleshooting.
The dashboard surfaces the health of the latest processed snapshot at a glance, including:
- Snapshot processing and collection exceptions
- Connectivity test and collection status
- Missing devices and links
- Historical collection behavior and performance
Its primary audience is Forward field teams onboarding new networks, with additional value for org admins and network engineers. All views support exporting data, either locally or directly to Forward, enabling field and engineering teams to review details offline.
Overall, the Onboarding Dashboard provides a single, actionable UI, making onboarding faster, more transparent, and easier to troubleshoot.
Overview
The main overview aggregates key onboarding and health signals for the latest processed snapshot.
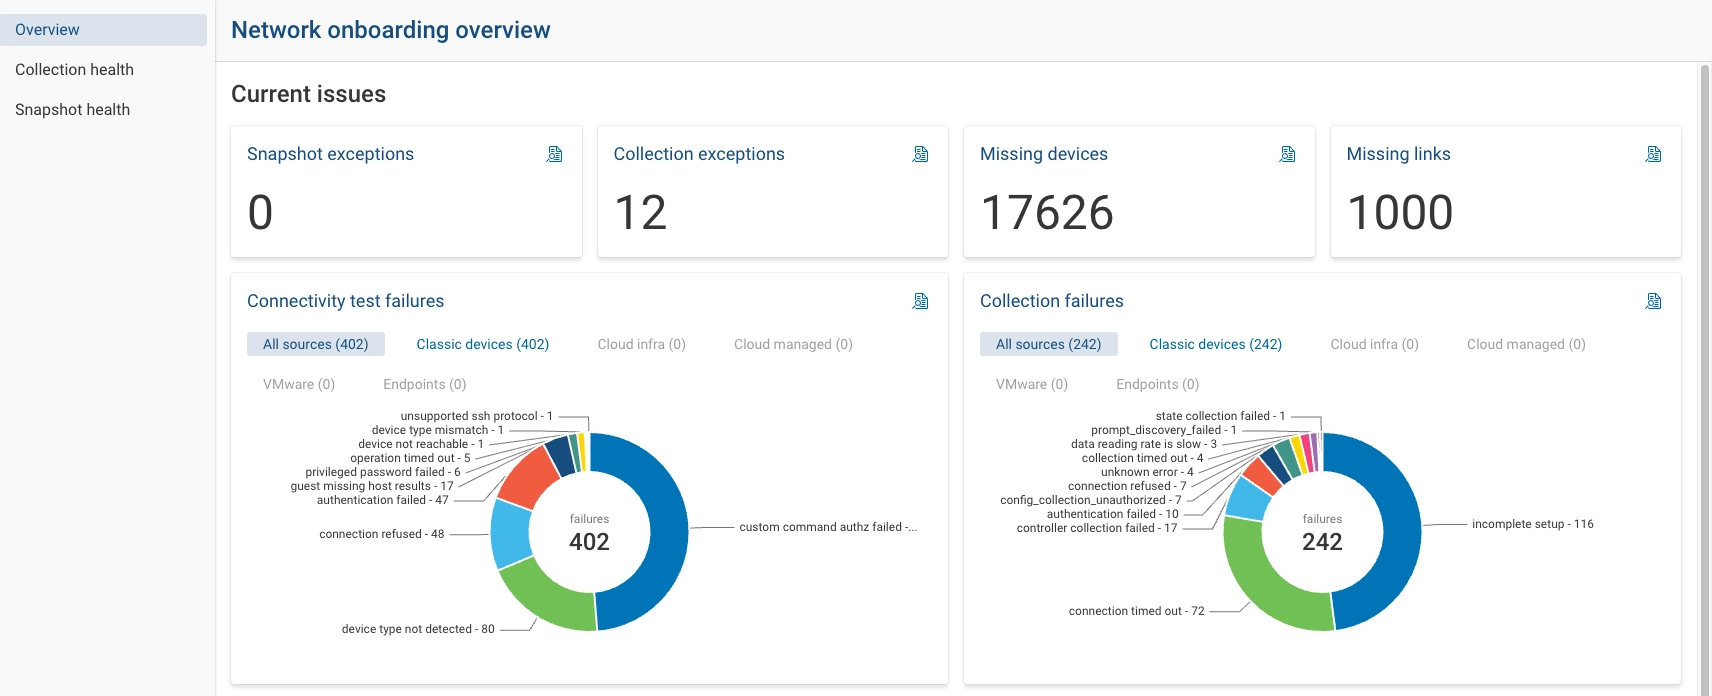
- Snapshot Exceptions lists processing exceptions in the snapshot (e.g., parser issues)
- Collection exceptions that occurred while collecting from the network
- Missing Devices highlights devices discovered indirectly (via LLDP, CDP, iBGP neighbors, OSPF neighbors) that are
not yet in collection
- Focuses on devices required for accurate modeling
- Supports a guided workflow to:
- Run subnet scan / connectivity tests
- Discover hostname and device type
- Add devices to Sources
- Missing Links surfaces potential link inference issues or missing links between interfaces
- Ranks candidates by importance (e.g., links that appear as next hops for many paths)
- Used by field teams to determine whether a link should exist or whether synthetic devices are required
- Connectivity test failures provides a status breakdown across all sources, with optional filtering by source type (classic devices, cloud infrastructure, etc.)
- Collection failures summarizes collection failures in the latest snapshot and where they occur
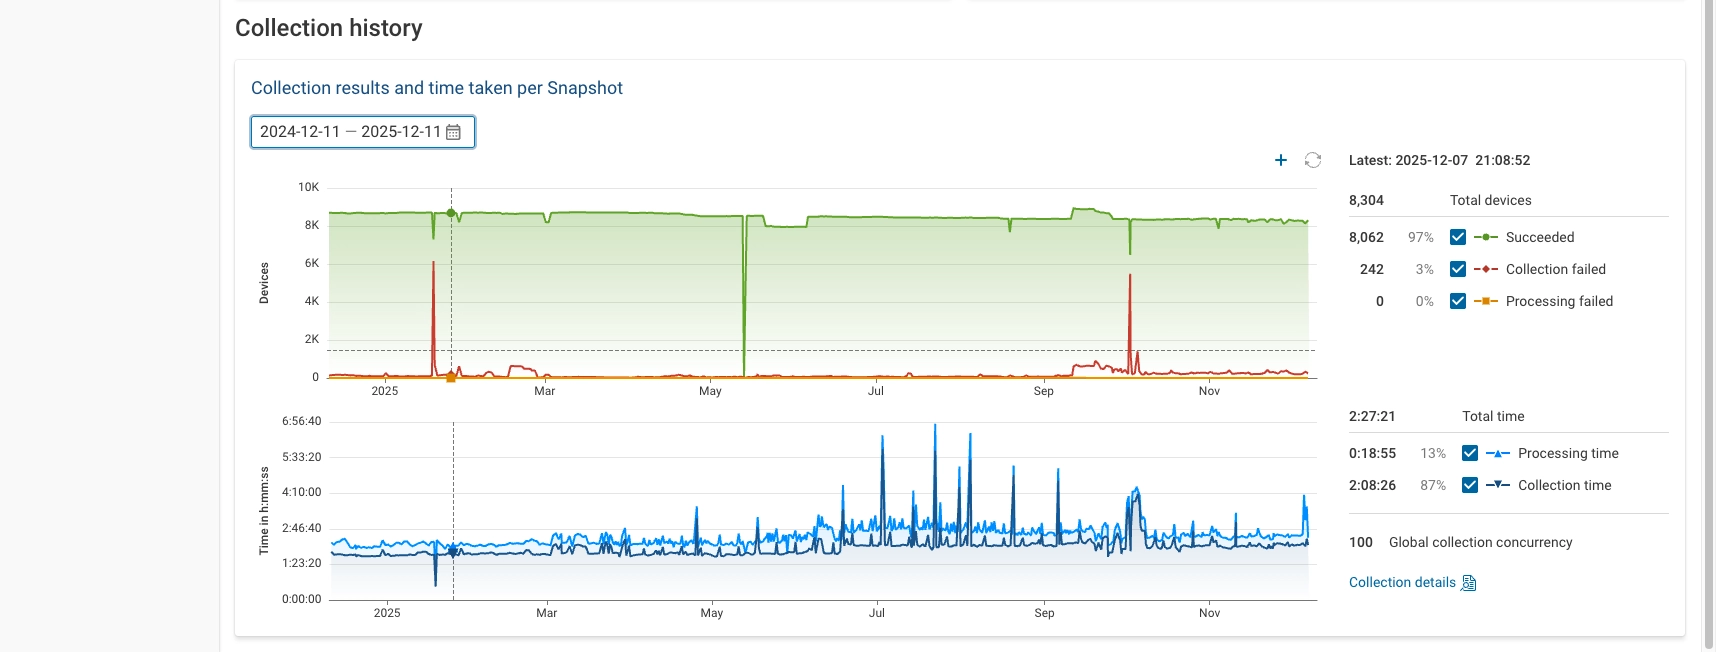
- Collection history shows:
- Number of devices successfully collected and processed
- Collection and processing duration over time
- Successful devices (green) now include backfilled data, so dips may no longer appear when backfill is present
- Failures (red) explicitly show spikes in failed collections, independent of backfill
Collection Health
The Collection Health and Connectivity Health views bring together historical context and current state.
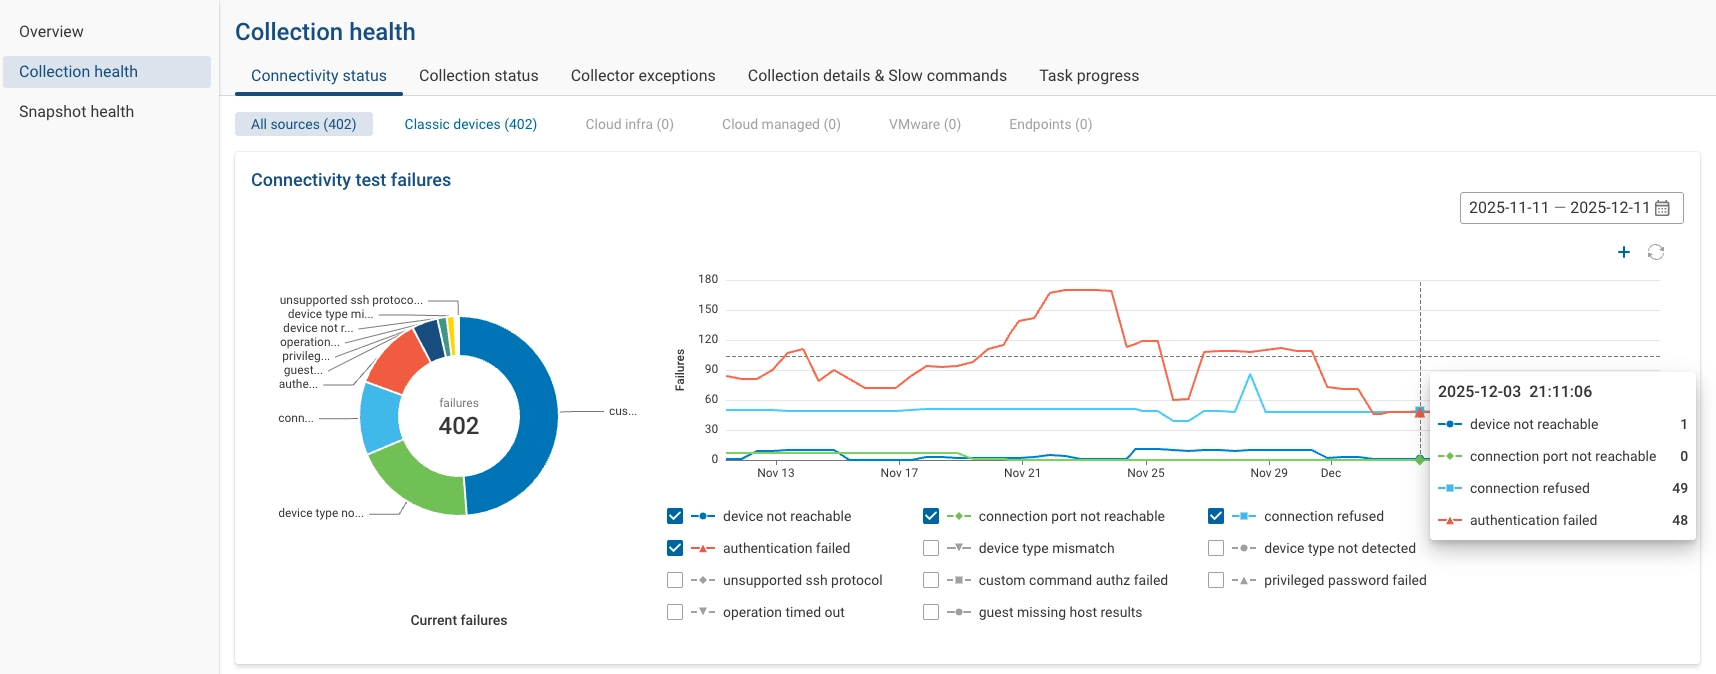
- Connectivity Status
- Historical view of connectivity test outcomes (e.g., unreachable, auth failures, connection refused)
- Filterable by source type (e.g., classic devices)
- Makes it easy to:
- See when a spike in authentication or connectivity failures started
- Verify when specific issues were resolved
- Collection Status
- Mirrors the connectivity view, but for collection status
- Reflects snapshot-level state (e.g., incomplete setup) per snapshot
- Collector Exceptions
- New, dedicated page for collector-side exceptions
- Shows:
- Exception type and phase (collection, connectivity, discovery, subnet scan, etc.)
- Collector version in which it occurred
- Number of occurrences
- Impacted devices and timestamps
- A deduplicated stack trace with an example log entry
- All data that was previously only available in collector logs and APIs is now accessible in the UI
- Supports exporting a report (including logs and stack traces) for escalation to Forward engineering, without increasing collector disk space usage
- Collection details & Slow commands
- Lists commands whose execution time exceeds a configurable threshold
- Default threshold: 10 minutes (whole minutes only)
- Threshold can be reduced (e.g., to 1 minute) to surface more potentially problematic commands
- Task Progress
- New visual timeline of collector tasks for a specific snapshot, including:
- Collection start/end times
- Number of tasks queued, in progress, successful, and failed over time
- Concurrency utilization versus configured limits (e.g., concurrency 32)
- Concurrency utilization per jump server, reflecting per-jump-host connection limits
- Helps diagnose:
- Why a collection is taking a long time
- Whether concurrency is underutilized
- Whether a small tail of slow tasks is dragging completion time
- New visual timeline of collector tasks for a specific snapshot, including:
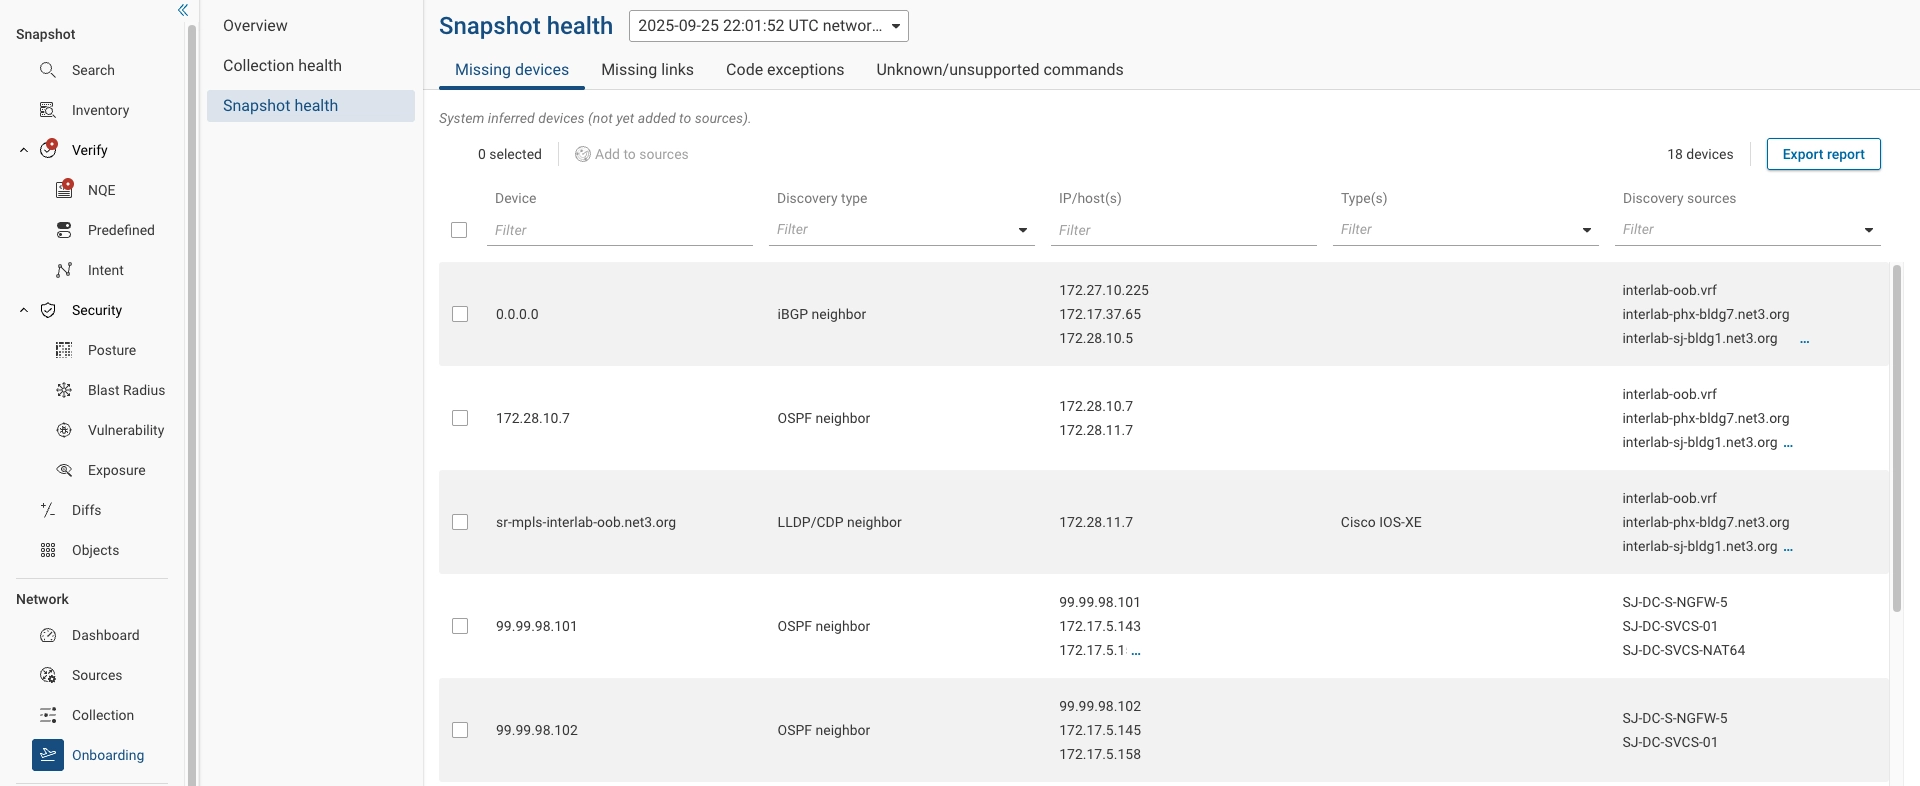
Snapshot Health
The Snapshot Health section focuses on the integrity and model quality of a specific snapshot.
- Missing Devices
- Highlights devices discovered indirectly (via LLDP, CDP, iBGP neighbors, OSPF neighbors) that are not yet in collection
- Focuses on devices required for accurate modeling
- Supports a guided workflow to:
- Run subnet scan / connectivity tests
- Discover hostname and device type
- Add devices to Sources
- Missing Links
- Surfaces potential link inference issues or missing links between interfaces
- Ranks candidates by importance (e.g., links that appear as next hops for many paths)
- Used by field teams to determine whether a link should exist or whether synthetic devices are required
- Code exceptions
- Snapshot Exceptions Processing (parser) exceptions encountered while analyzing the snapshot
- Collection Exceptions including:
- Collector version
- Number of occurrences
- Impacted devices
- Example exception details
- Unknown / Unsupported Commands provides a deduplicated list of unknown and unsupported commands. For each command it shows an example instance in context within the device configuration