Understanding Results
A path search returns the paths the traffic could take through the modeled network, broken down into the devices traversed and the forwarding and policy decisions at every hop. This page covers how to read those results.
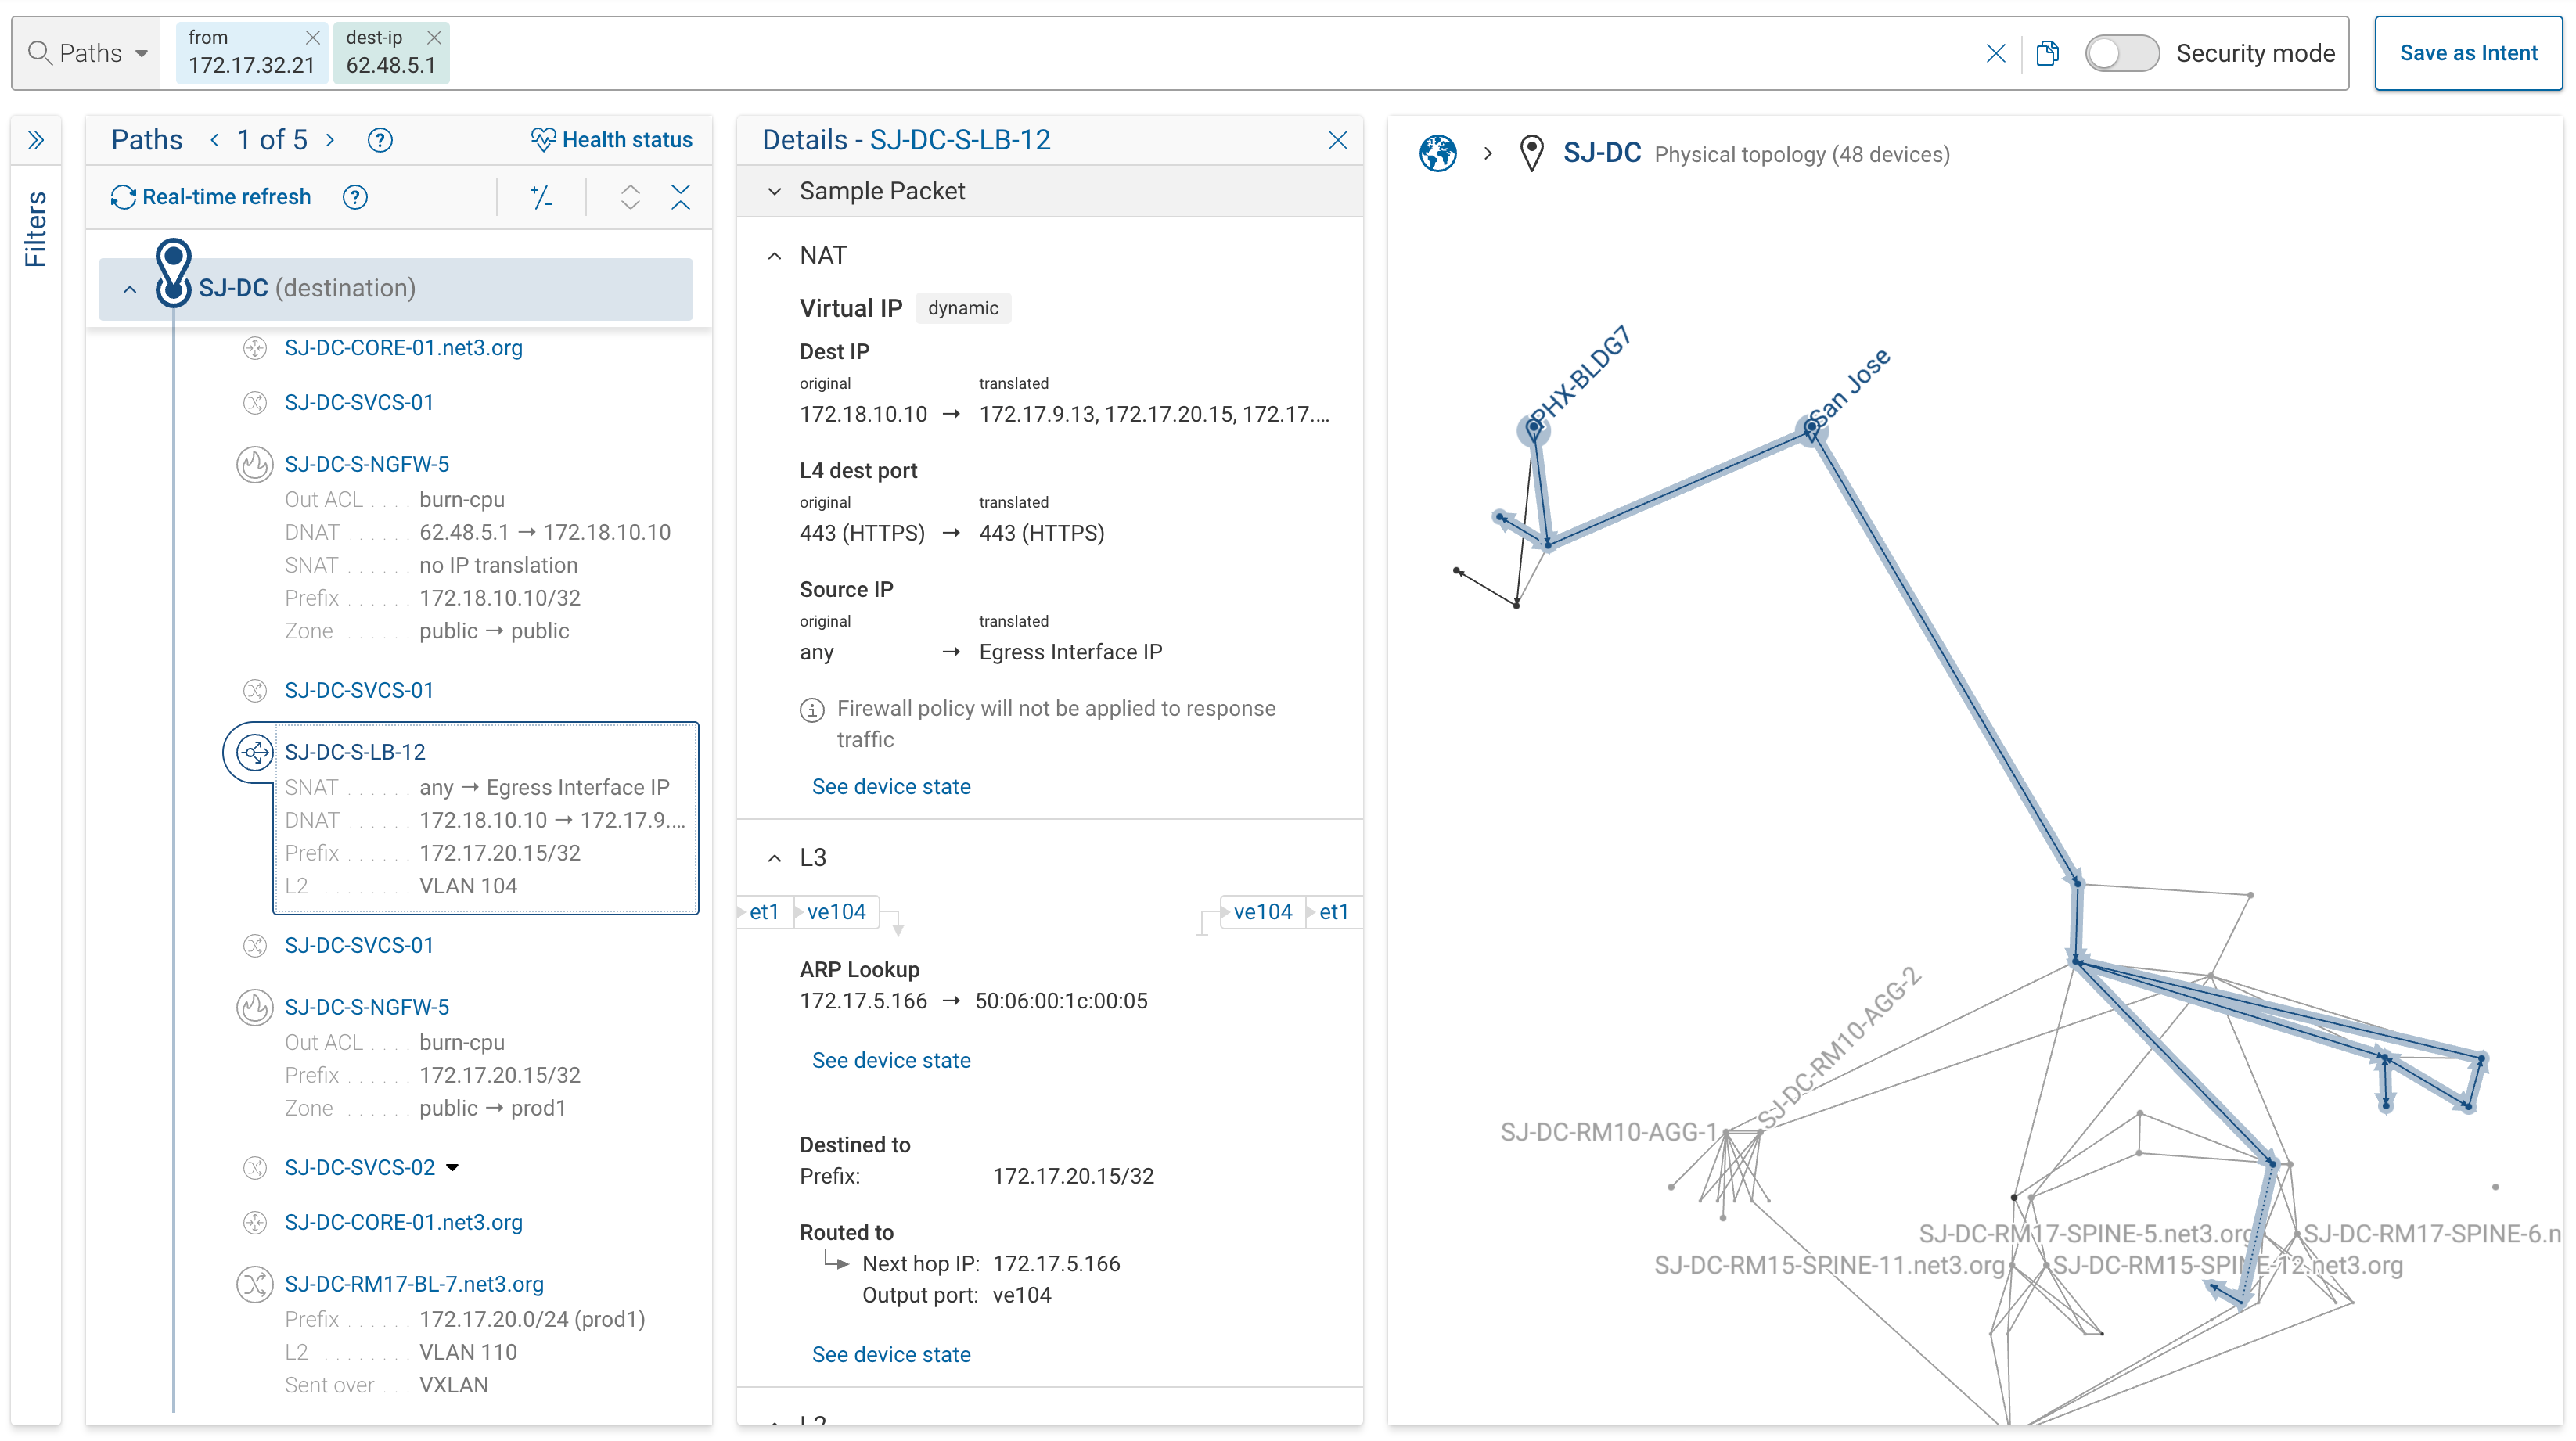
Results have three layers:
- Path groups — paths with the same significant hops and the same outcome, grouped together
- Covered topology — every device and link touched by any matching path, highlighted on the map
- Hop-by-hop detail — the forwarding, policy, and translation decisions at each device on a selected path
Path Groups
A single query usually produces several paths. Paths that traverse the same significant devices and reach the same outcome are collapsed into a path group.
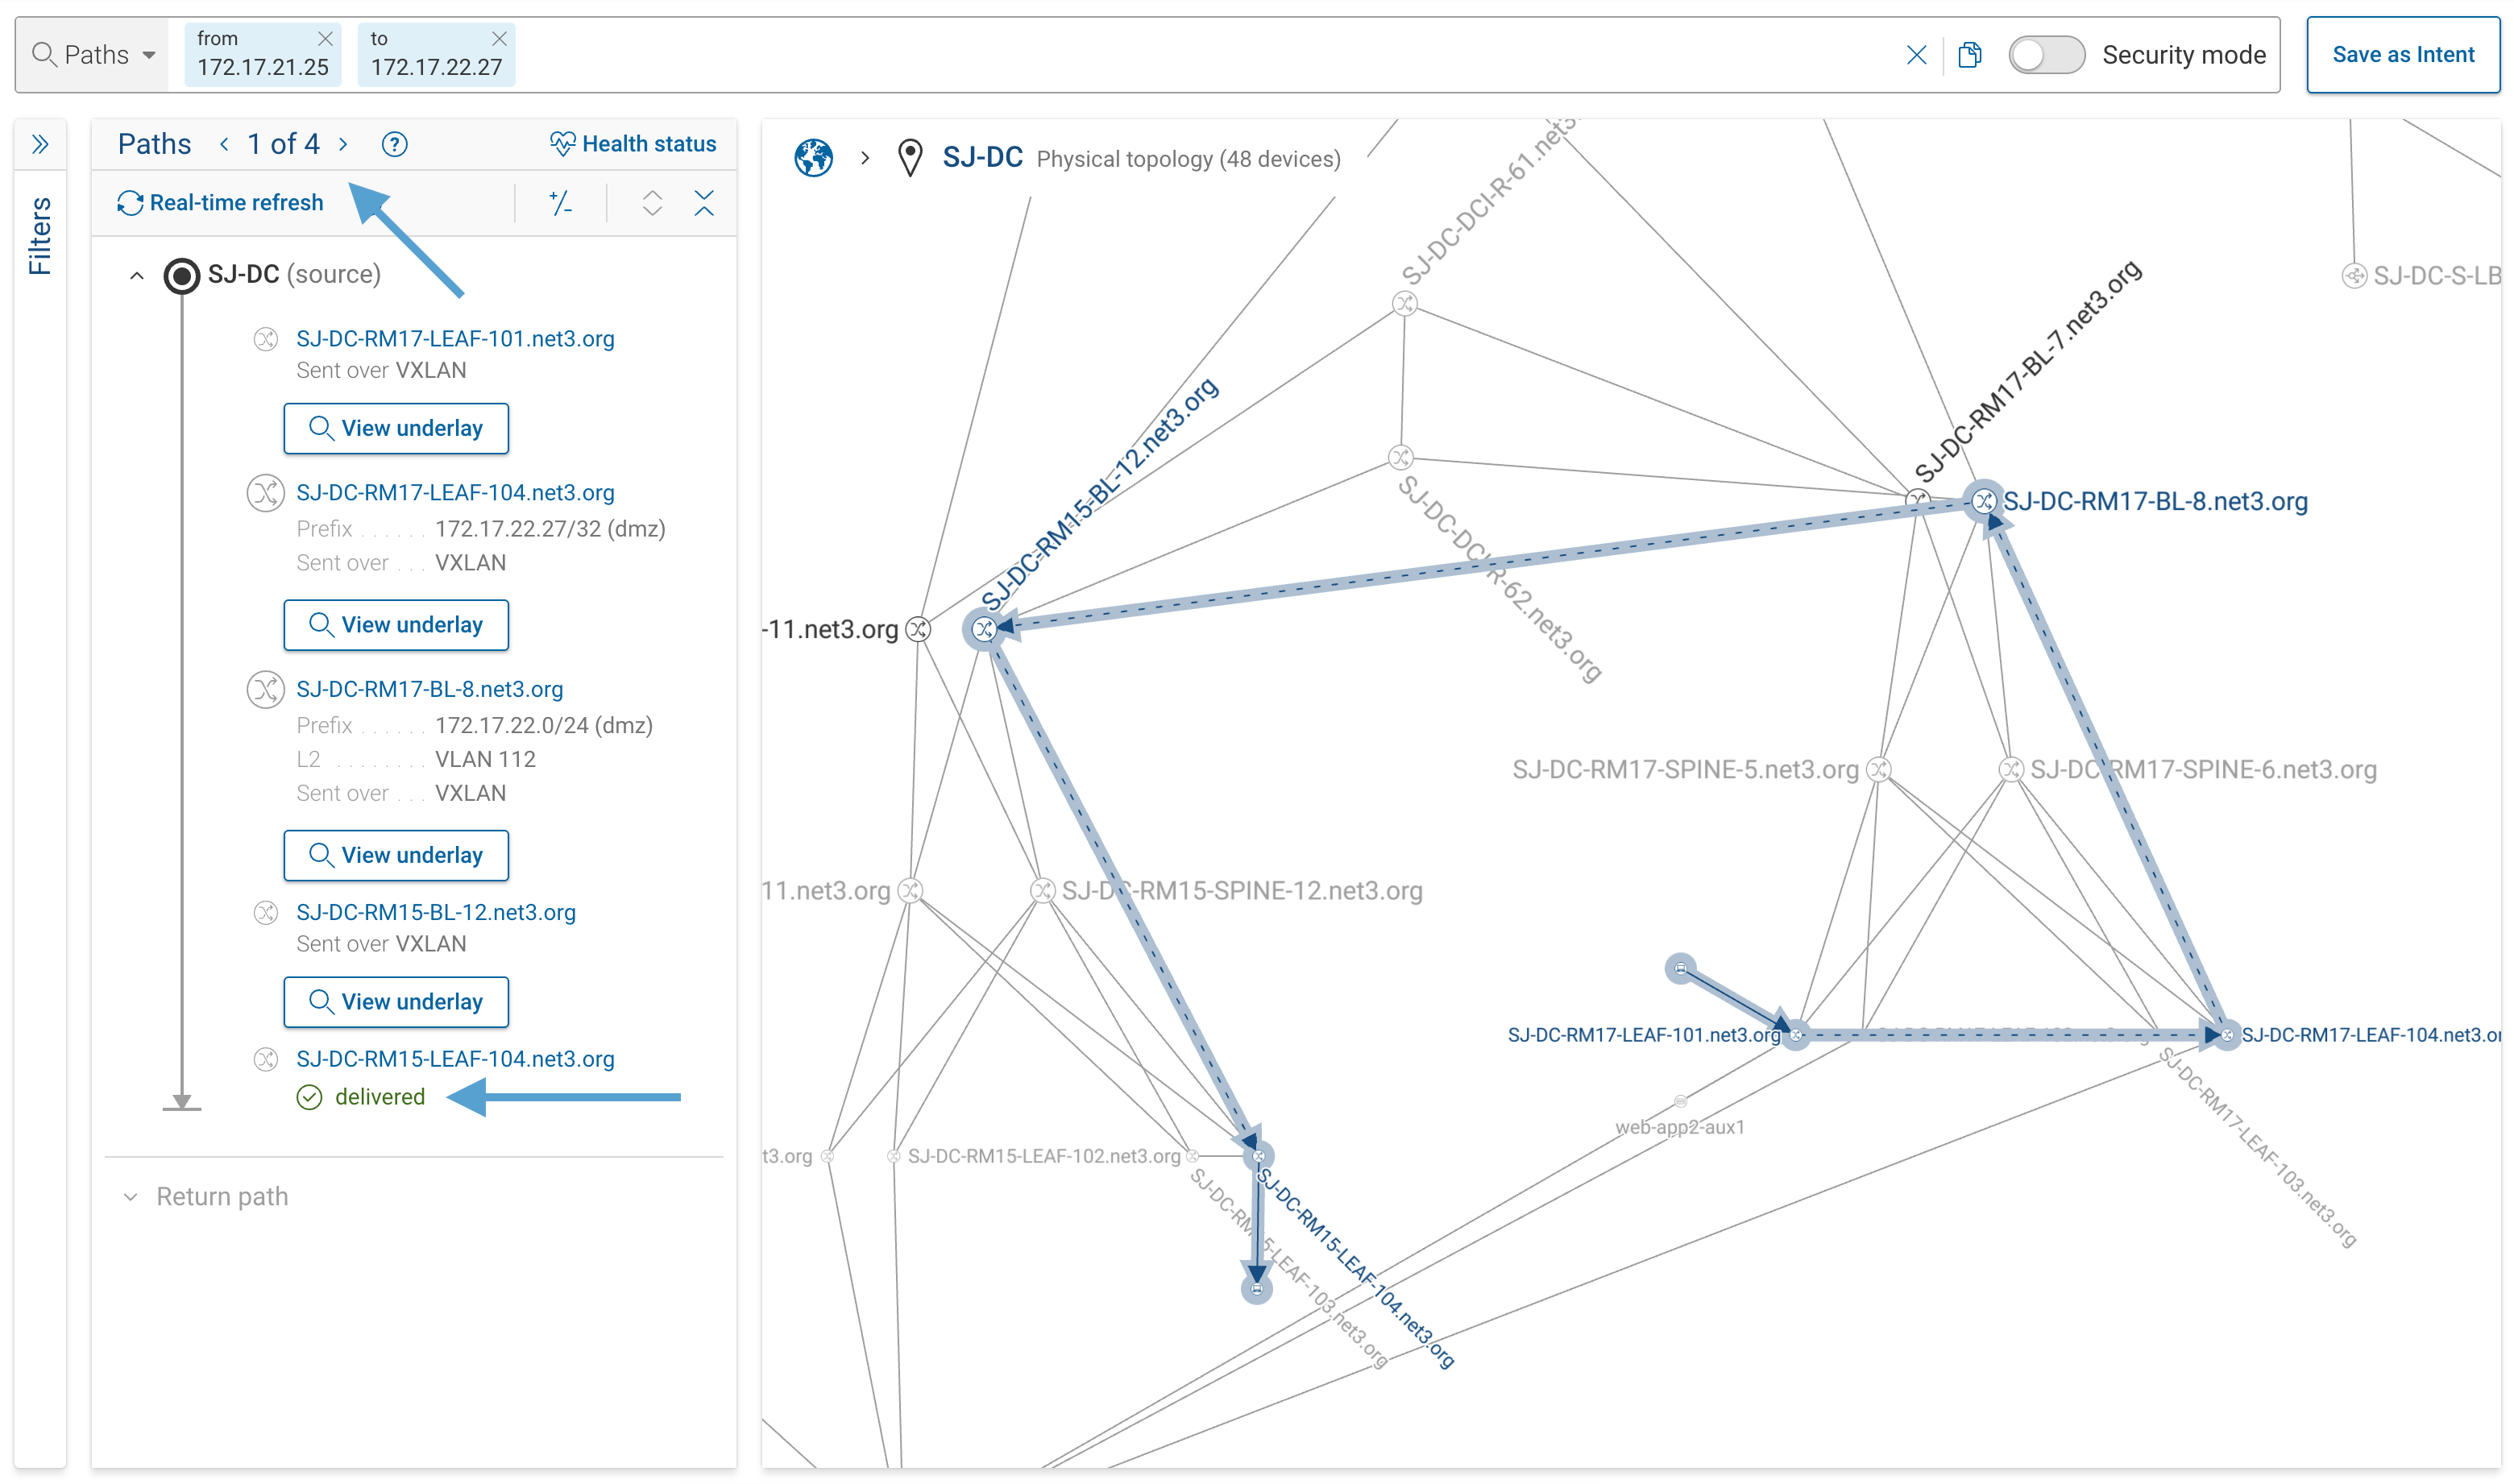
Each group shows:
- Outcome badge — the group's outcome (delivered, dropped, blackhole, loop, inadmissible, unreachable); see Outcome values for definitions
- Device sequence — the ordered list of devices traffic transits
- Path count — the number of individual paths in the group; step through with Previous/Next
- Significant hops — devices that distinguish this group from the others, rendered with larger icons
Multiple groups appear when the same traffic takes meaningfully different routes (ECMP fan-out, asymmetric routing,
overlay/underlay split) or reaches different outcomes. A query matches a range of packets, not a single flow, so a
delivered group alongside a dropped group means the matching traffic splits: some packets reach the destination
while others are dropped. Open the dropped group to see which packets stop and where.
Paths within a group share the same significant hops but may differ in minor ways: a different ECMP next-hop, a different underlay link. Step between them with the path navigator.
Covered Topology
The topology map highlights every device and link touched by any matching path, across all path groups.
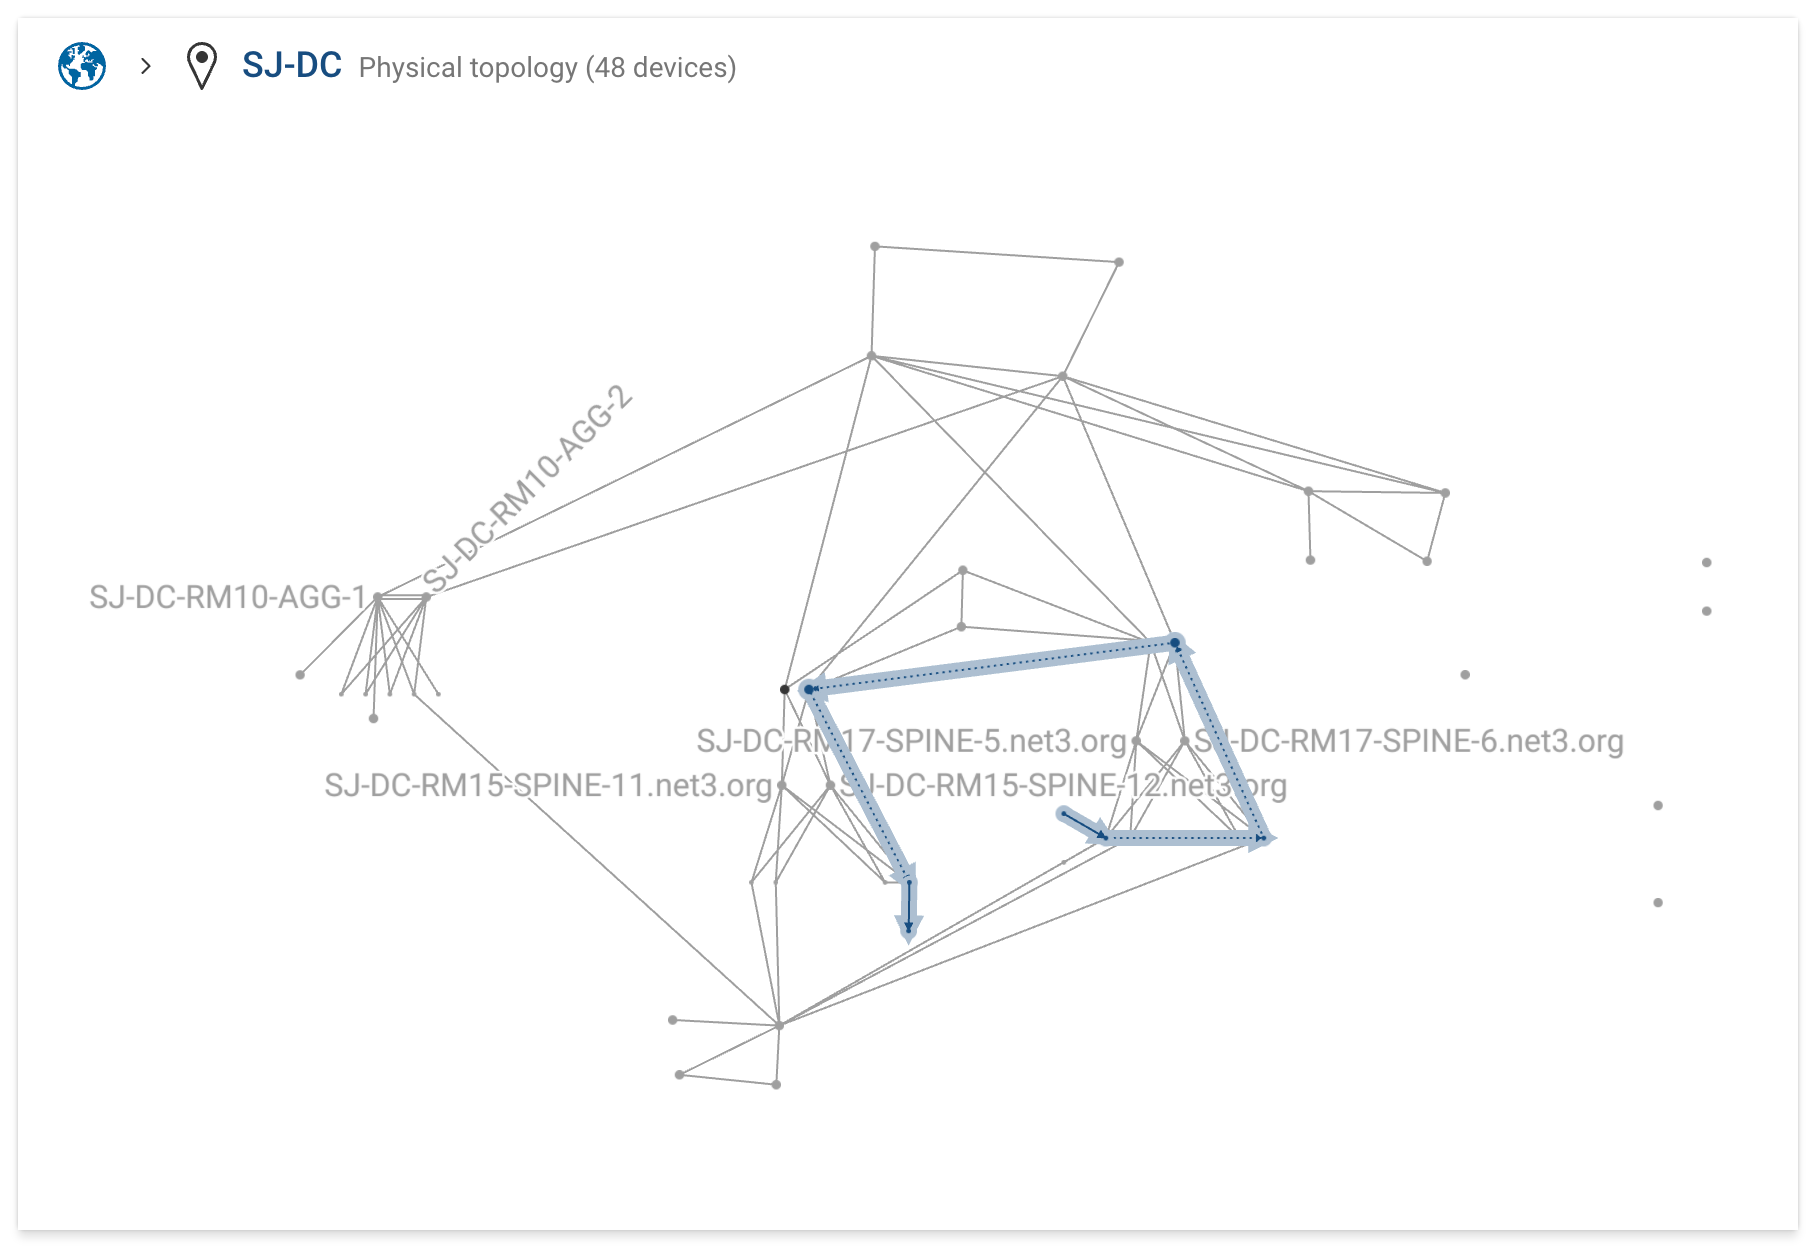
- Highlighted elements are part of at least one matching path
- Faded elements are not
- Coverage spans all path groups, not just the selected one
- The selected path is highlighted within the covered topology, so you can see the hops of the group you opened against the full set of touched devices
Check whether the traffic touches the devices you expected, and nothing more.
Hop-by-Hop Detail
Click a device on a selected path to open the hop detail panel.
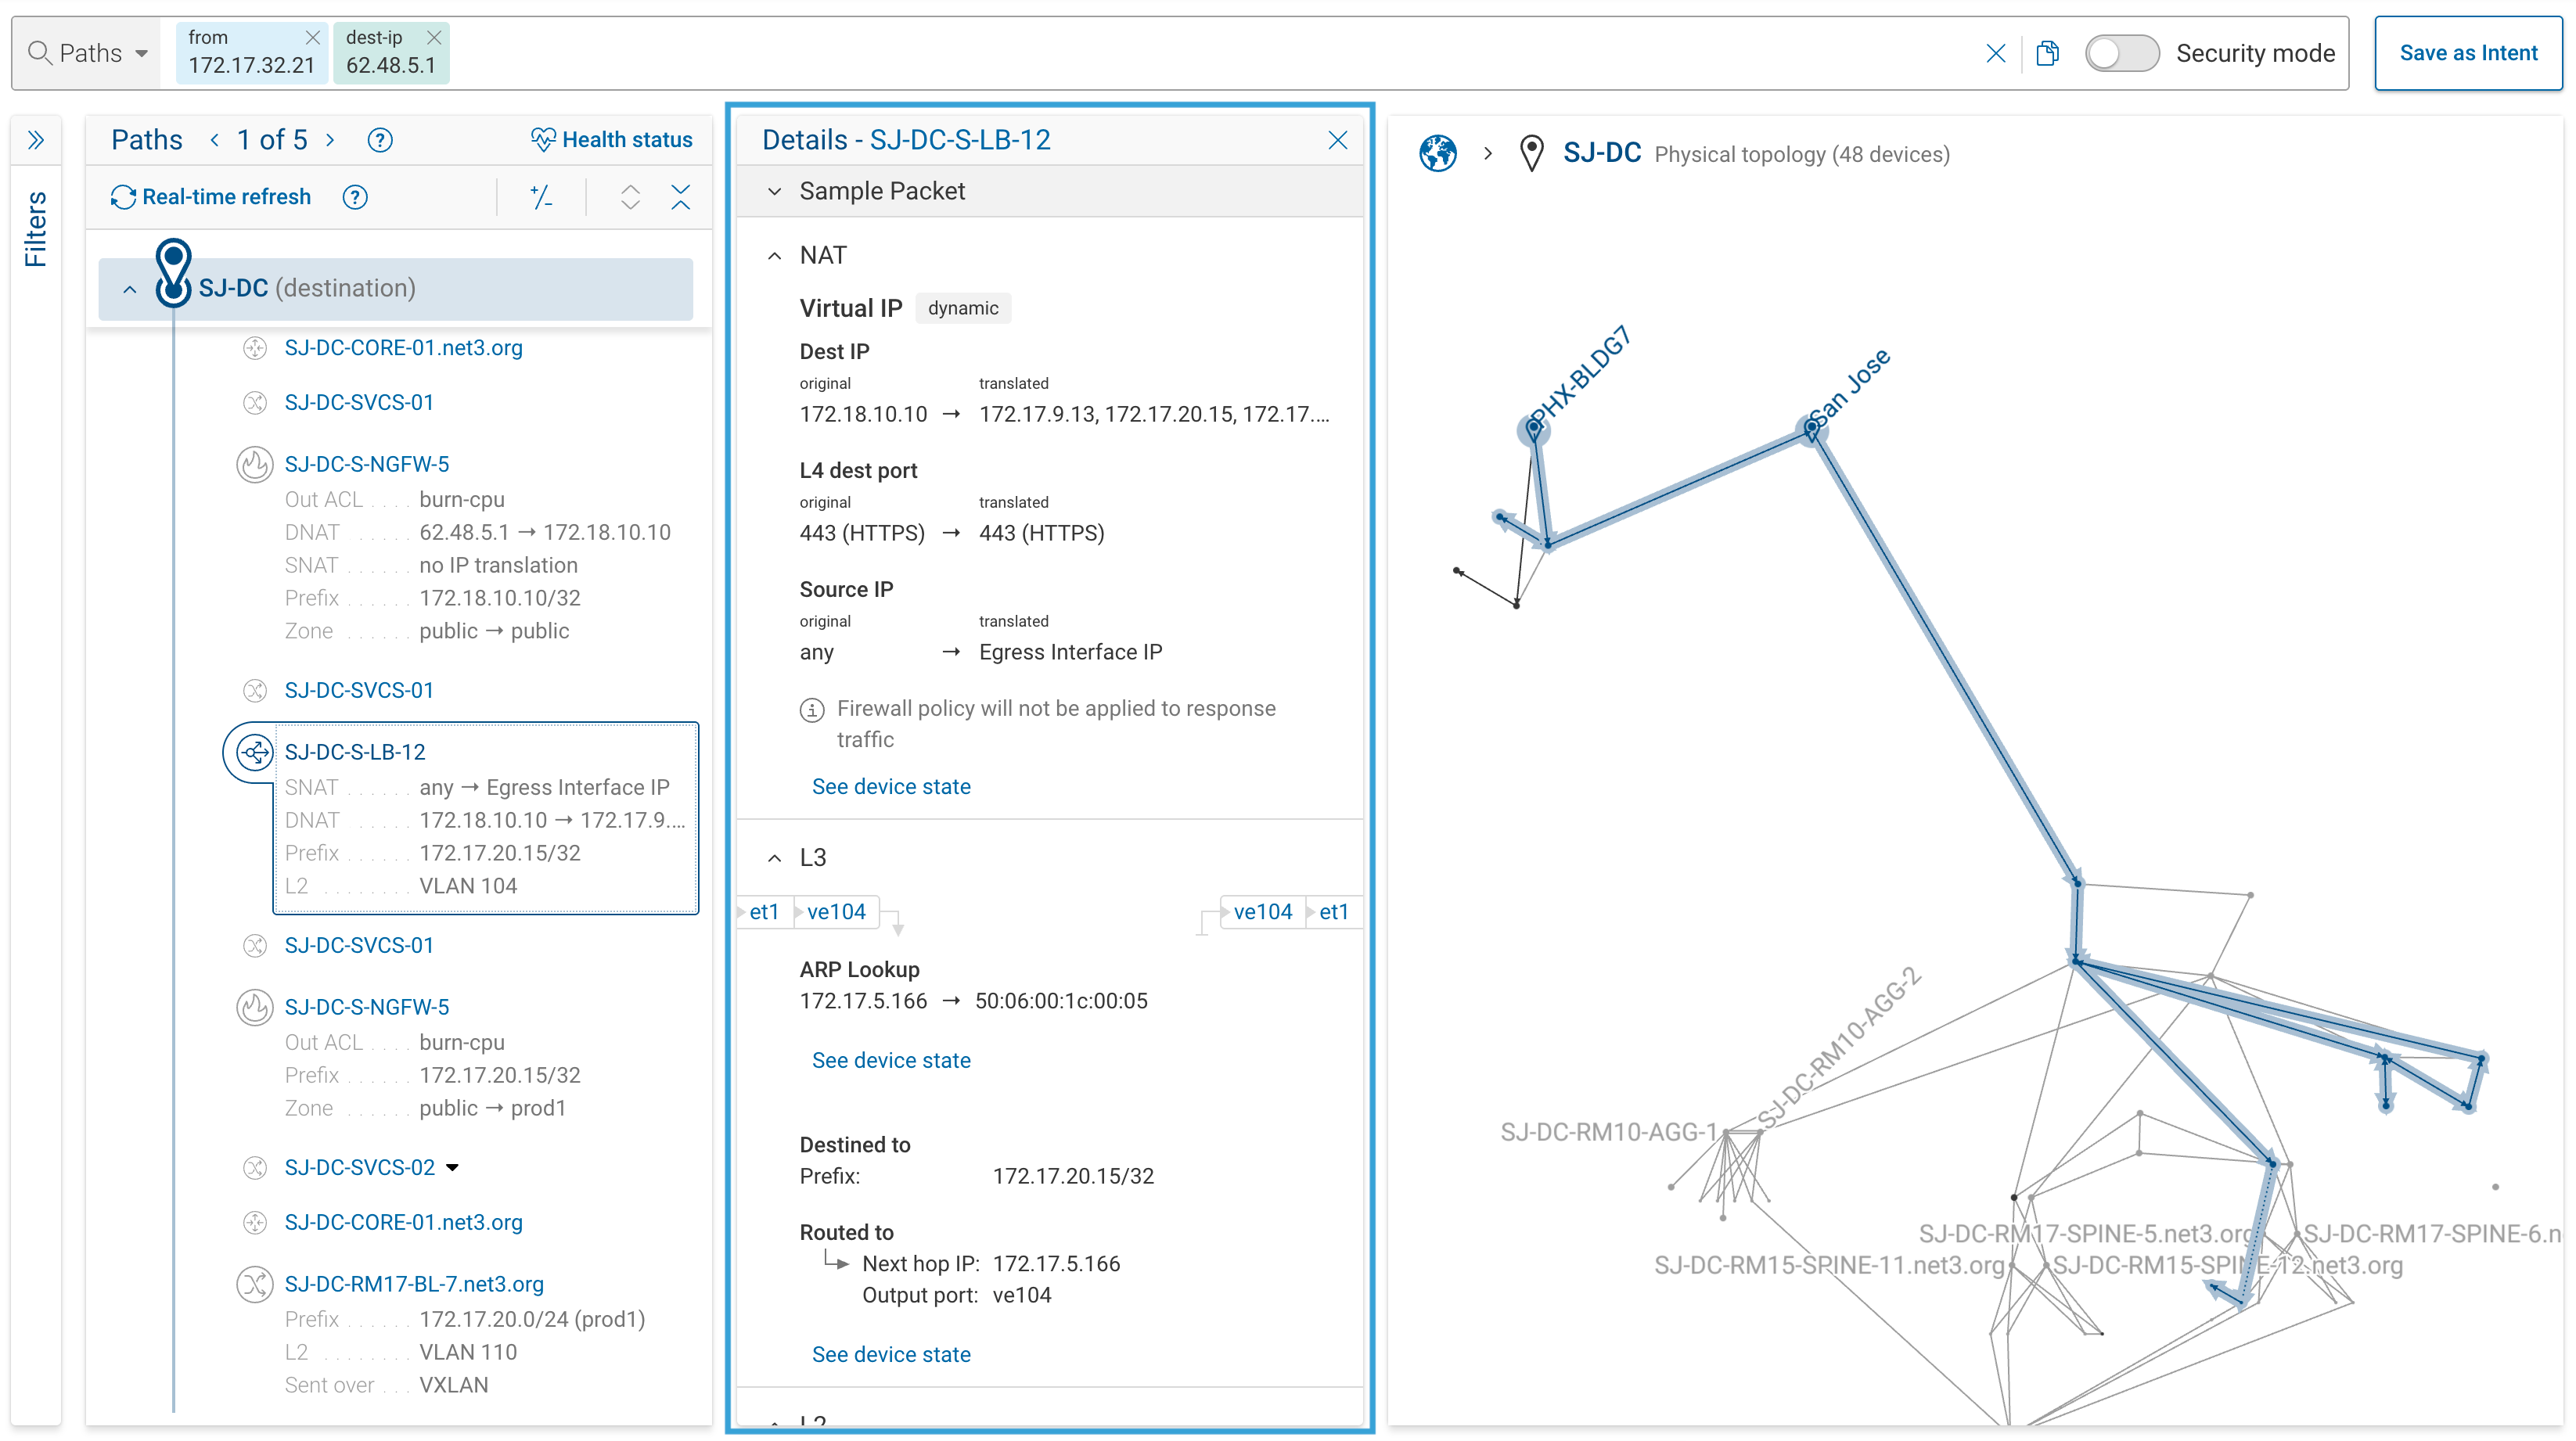
Each hop shows the device name (click it to open a search card for that device) and its ingress and egress interfaces, with unhealthy or drop-causing interfaces flagged.
Network Functions
At each hop, Forward evaluates the forwarding, policy, and translation operations the device would perform. These are grouped by layer in collapsible sections. Only layers that the device actually exercises appear — a simple L3 forward may render just an L3 section, while a firewall may additionally show Access Control and NAT.
| Layer | Functions |
|---|---|
| Access Control | Ingress/egress ACLs, policy-based routing, stateful response ACLs |
| NAT | Source and destination NAT, virtual IP, proxy and reverse proxy, NAT64 |
| L3 | IP routing, ARP resolution, MPLS label switching, L3 VXLAN encapsulation |
| L2 | MAC forwarding, broadcast-domain forwarding, FabricPath, L2 VXLAN, ACI EPG evaluation |
For each function, the panel shows the configured attributes (rule name, VRF, ACL type), what matched (the header fields evaluated), and the action applied (permit, deny, forward, translate, push/pop, drop).
Cloud devices (AWS, Azure, GCP, IBM Cloud, Alkira) render their functions in a separate Cloud panel with per-function titles — security groups, network ACLs, cloud routing, load balancers, NAT, VPC peering, and others. For the full set of cloud functions and the attributes each one shows, see Reference → Cloud panel.
ECMP at a Single Hop
When a routing lookup returns multiple equal-cost next-hops, each alternative appears as an ECMP path entry with its next-hop IP, egress interface, and any label operations.
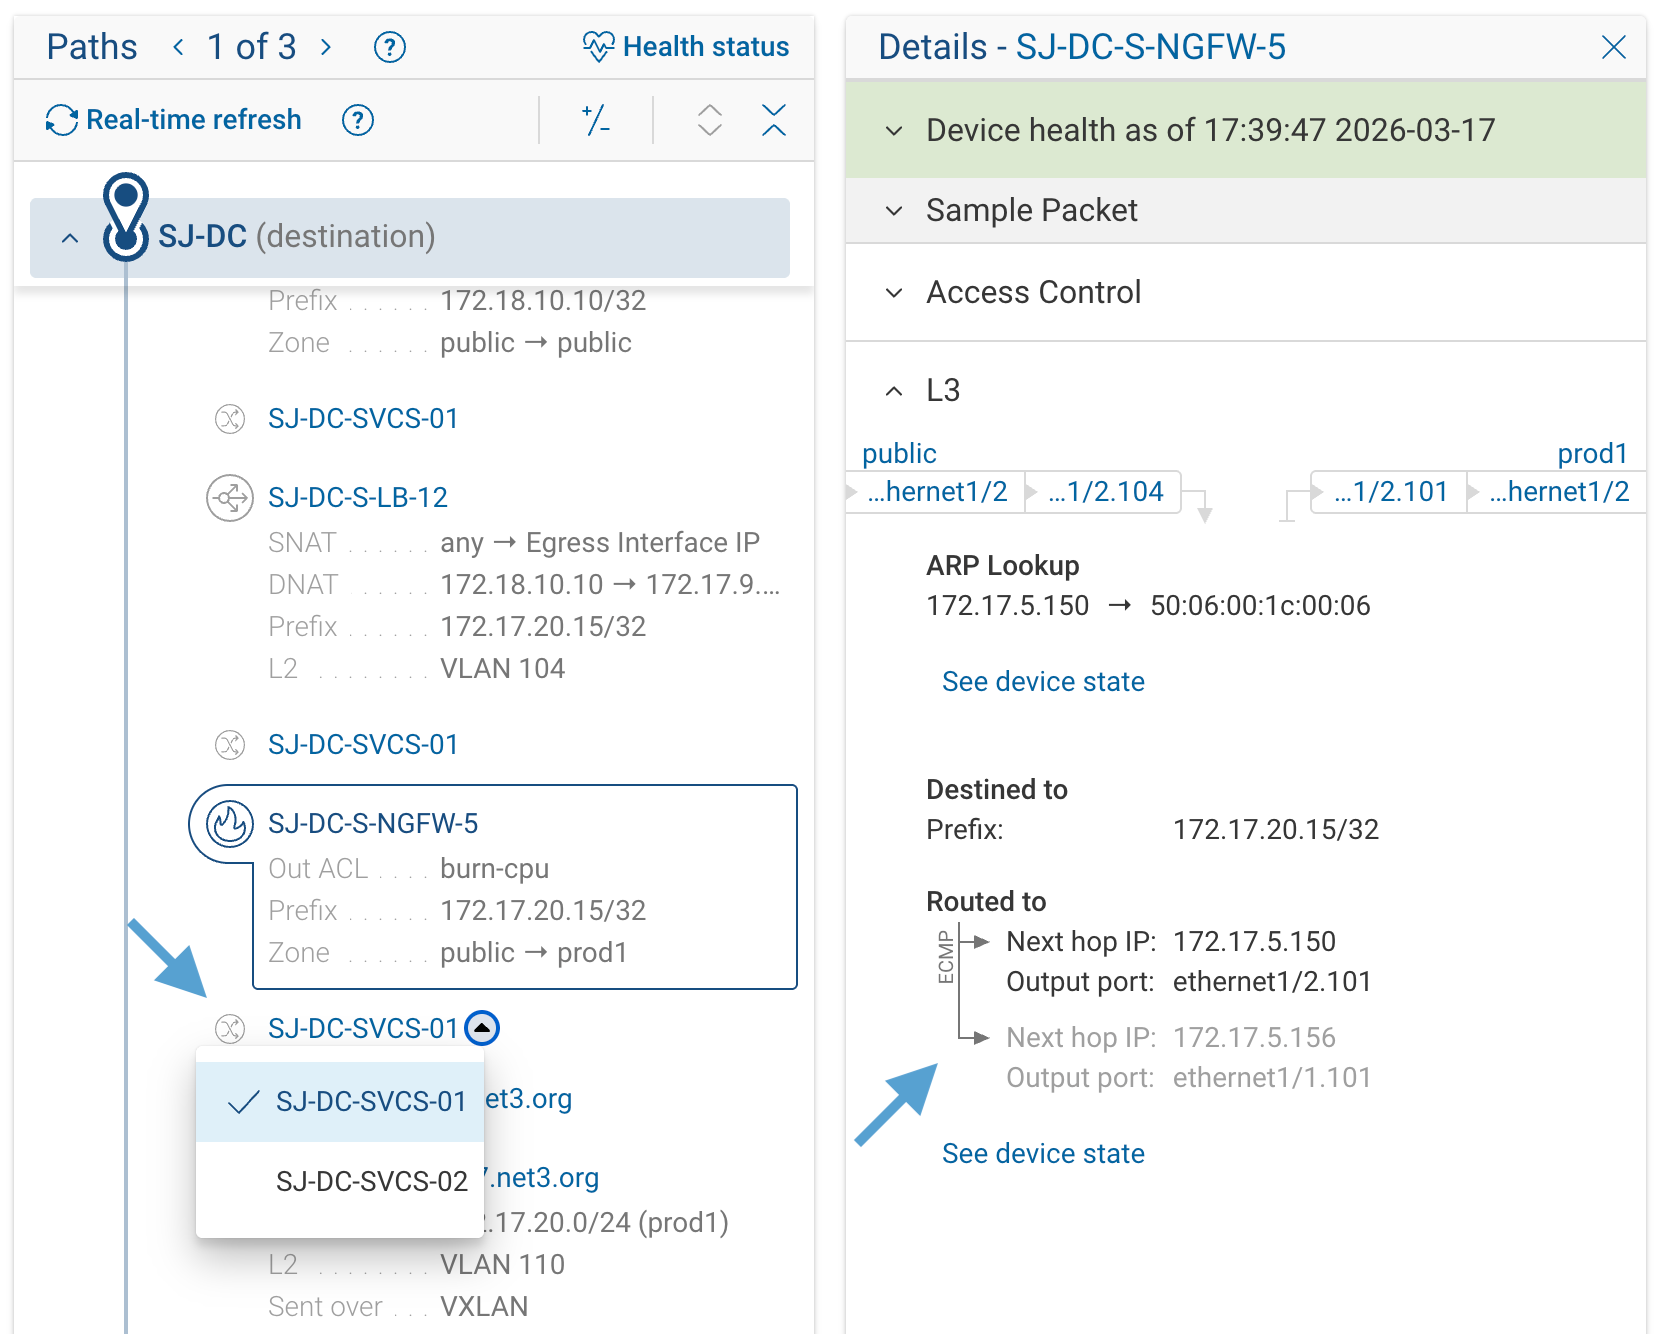
Forward models these alternatives from the information collected off the device. The one listed first is not necessarily the active choice — hardware load-balancing decisions are not visible to Forward, so from the model's point of view every listed ECMP path is equally possible.
See Device State
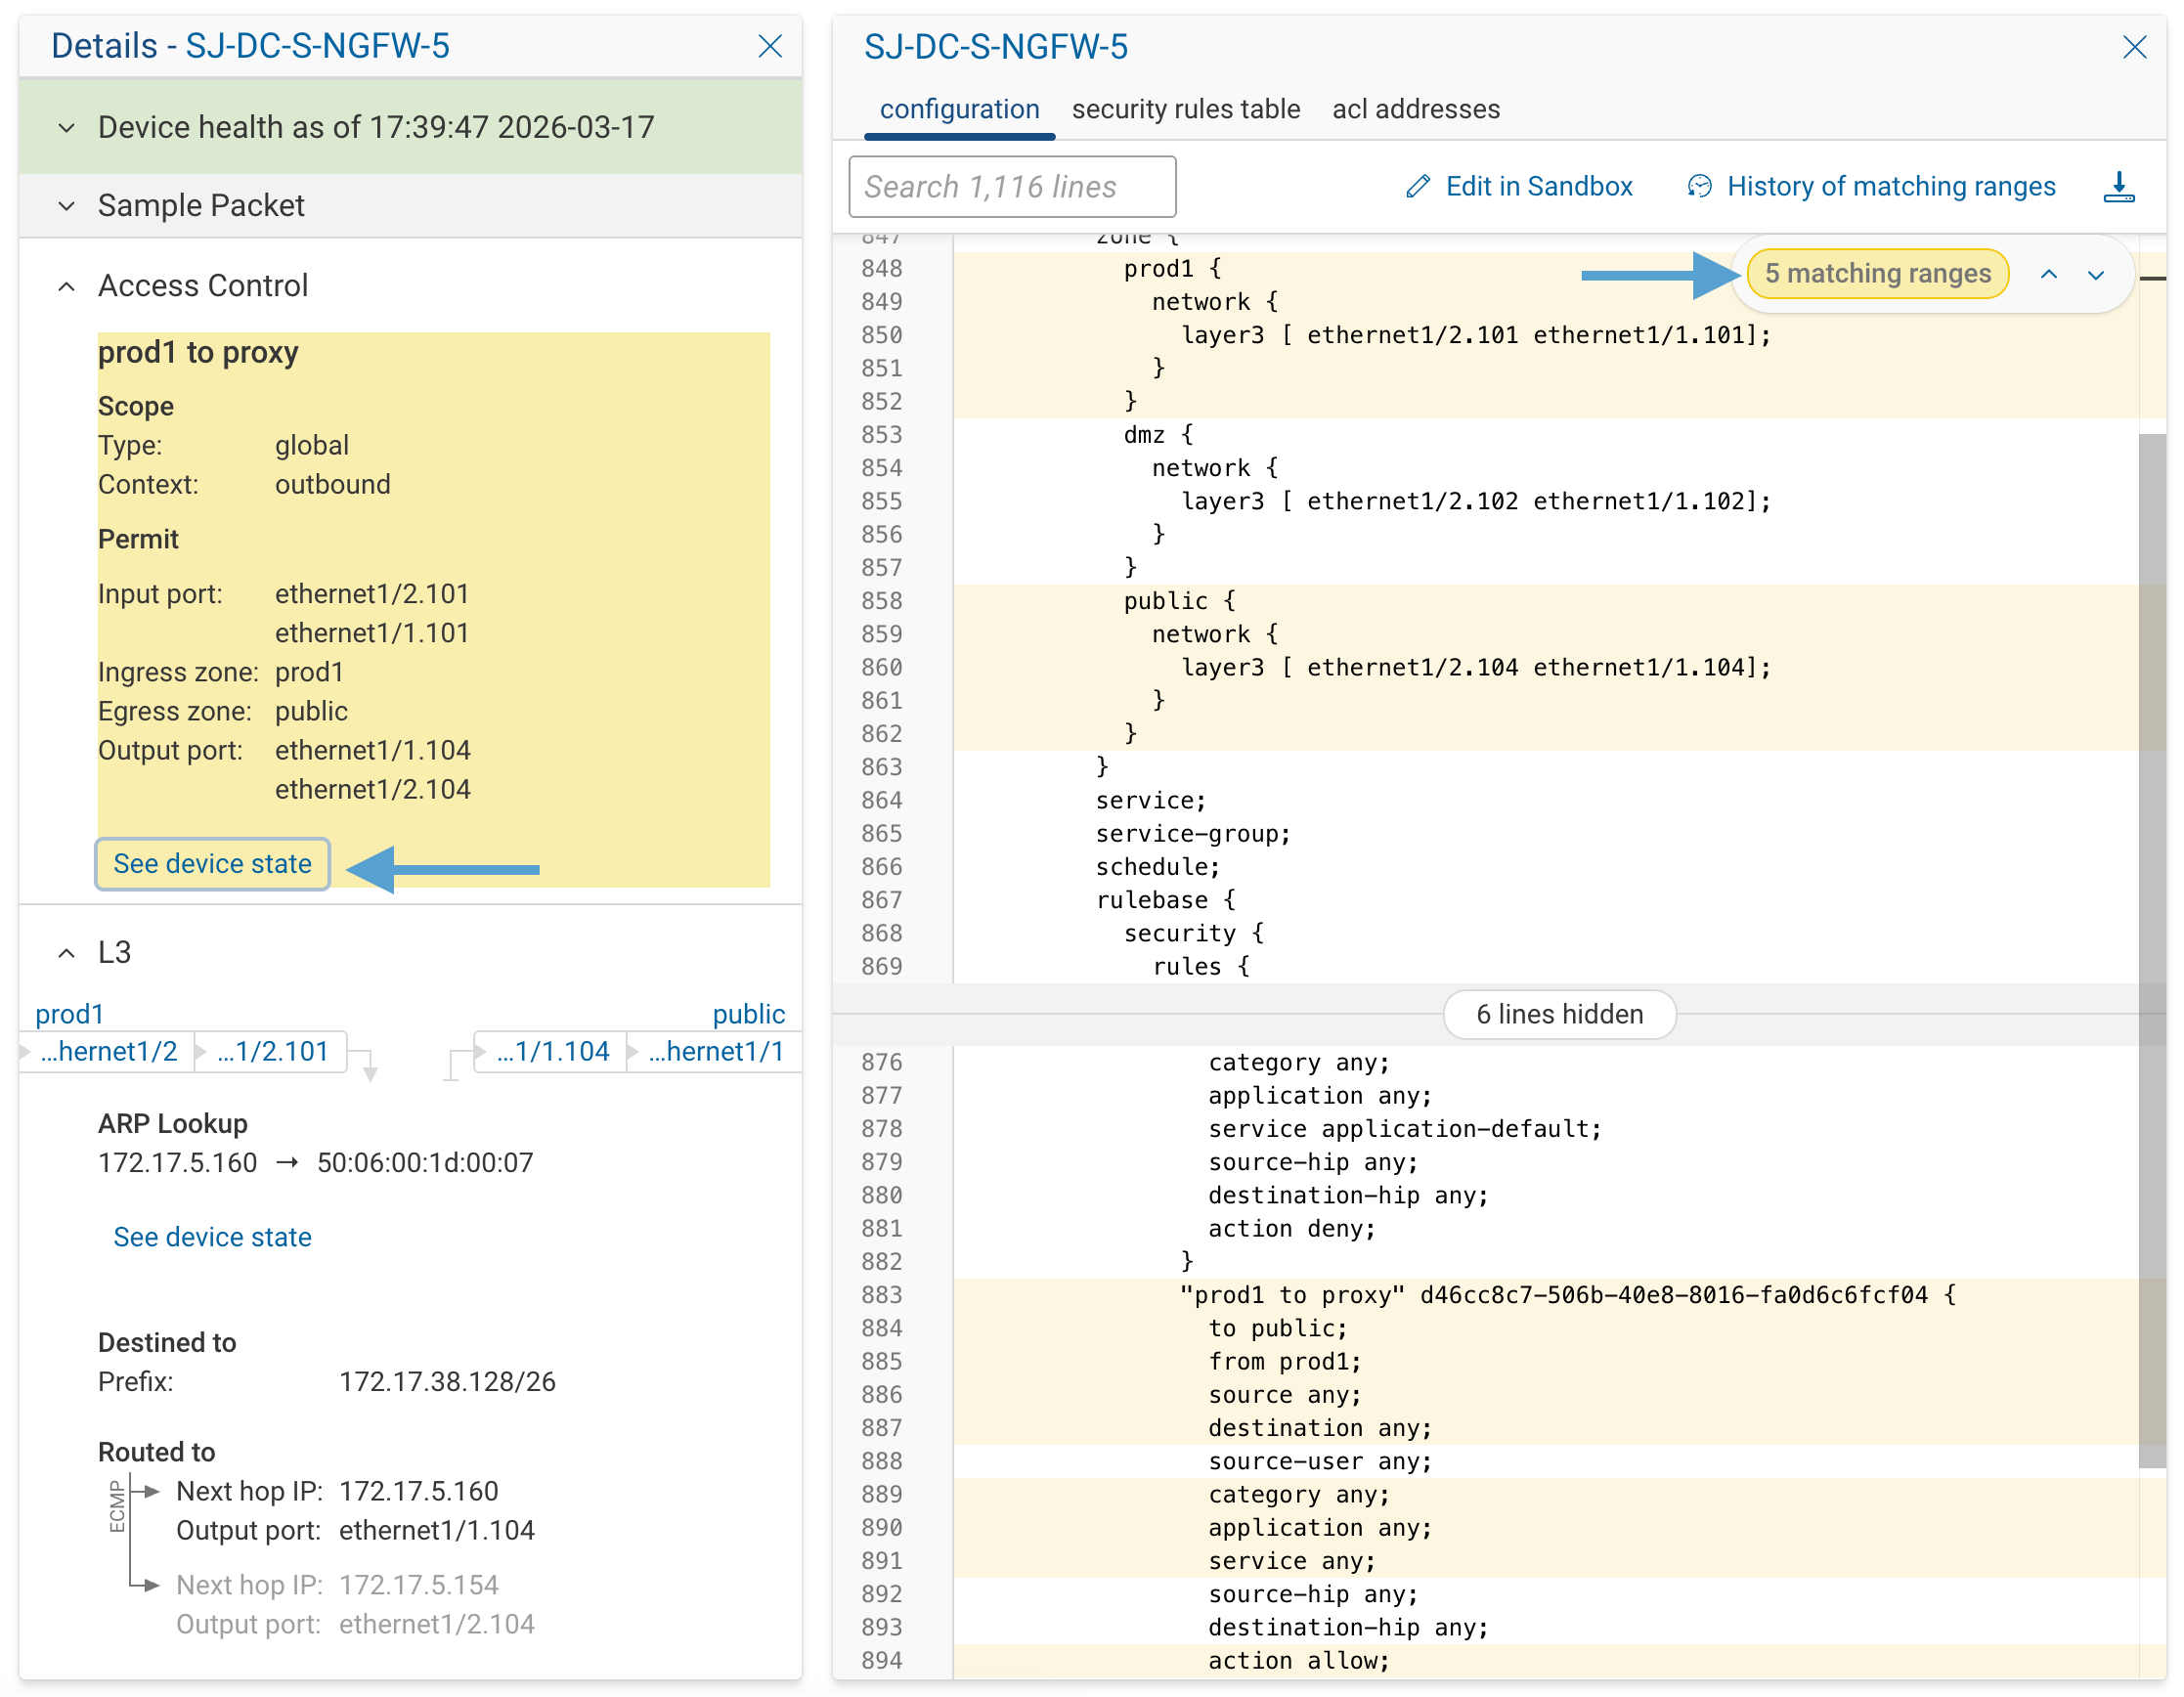
Whenever a device decision is driven by specific configuration or collected state, a See device state link appears next to that decision. It opens the device's config or state file, scrolled to the exact lines Forward used to model the behavior — whatever steered the traffic: a route entry, ACL or firewall rule, NAT policy, MAC or ARP table entry, VXLAN mapping, policy-map, and so on.
Drops
When a network function or interface stops the traffic, the hop shows a status line explaining why — for example, "Dropped because [reason]". The reason string is drawn from a catalog specific to the function type (ACL, IP route, ARP, NAT, OpenFlow, interface-level, and U-turn). For the full catalog, see the Reference.
When a path is dropped by an ACL or firewall rule, a Try permit all mode banner appears near the hop diagram. Clicking it re-runs the search with ACLs disabled network-wide; if traffic is delivered in permit-all mode but dropped normally, the problem is policy rather than connectivity. For how to use this in practice, see Troubleshooting & FAQ.
Alternative Paths at a Hop
Each hop in the path diagram shows a dropdown caret when alternative paths pass through the same device. The dropdown groups alternatives as longer paths to here, shorter paths to [device], same-length paths to [device], and longer paths from here. Selecting an alternative switches the displayed path without re-running the query. This is useful when a path group contains many paths and you want to jump to one with a specific device further upstream or downstream.
Health Indicators
Hops can carry small icons that flag device or interface health issues along the path:
- Unhealthy device — the device is flagged as degraded; yellow for medium severity, red for high.
- Unhealthy interface — one or more of the hop's interfaces are flagged as degraded, same severity colors.
- Has violations — the device or interface has active NQE decorator violations on this path.
If your deployment includes performance data, a Health status button at the top of the result list opens a drawer with device and interface metrics for the current path. For the full badge catalog and what triggers each, see the Reference; for how health thresholds are collected and configured, see Device Performance.
Sample Packet
For the selected path, Forward shows the sample packet and how its headers change at each hop.
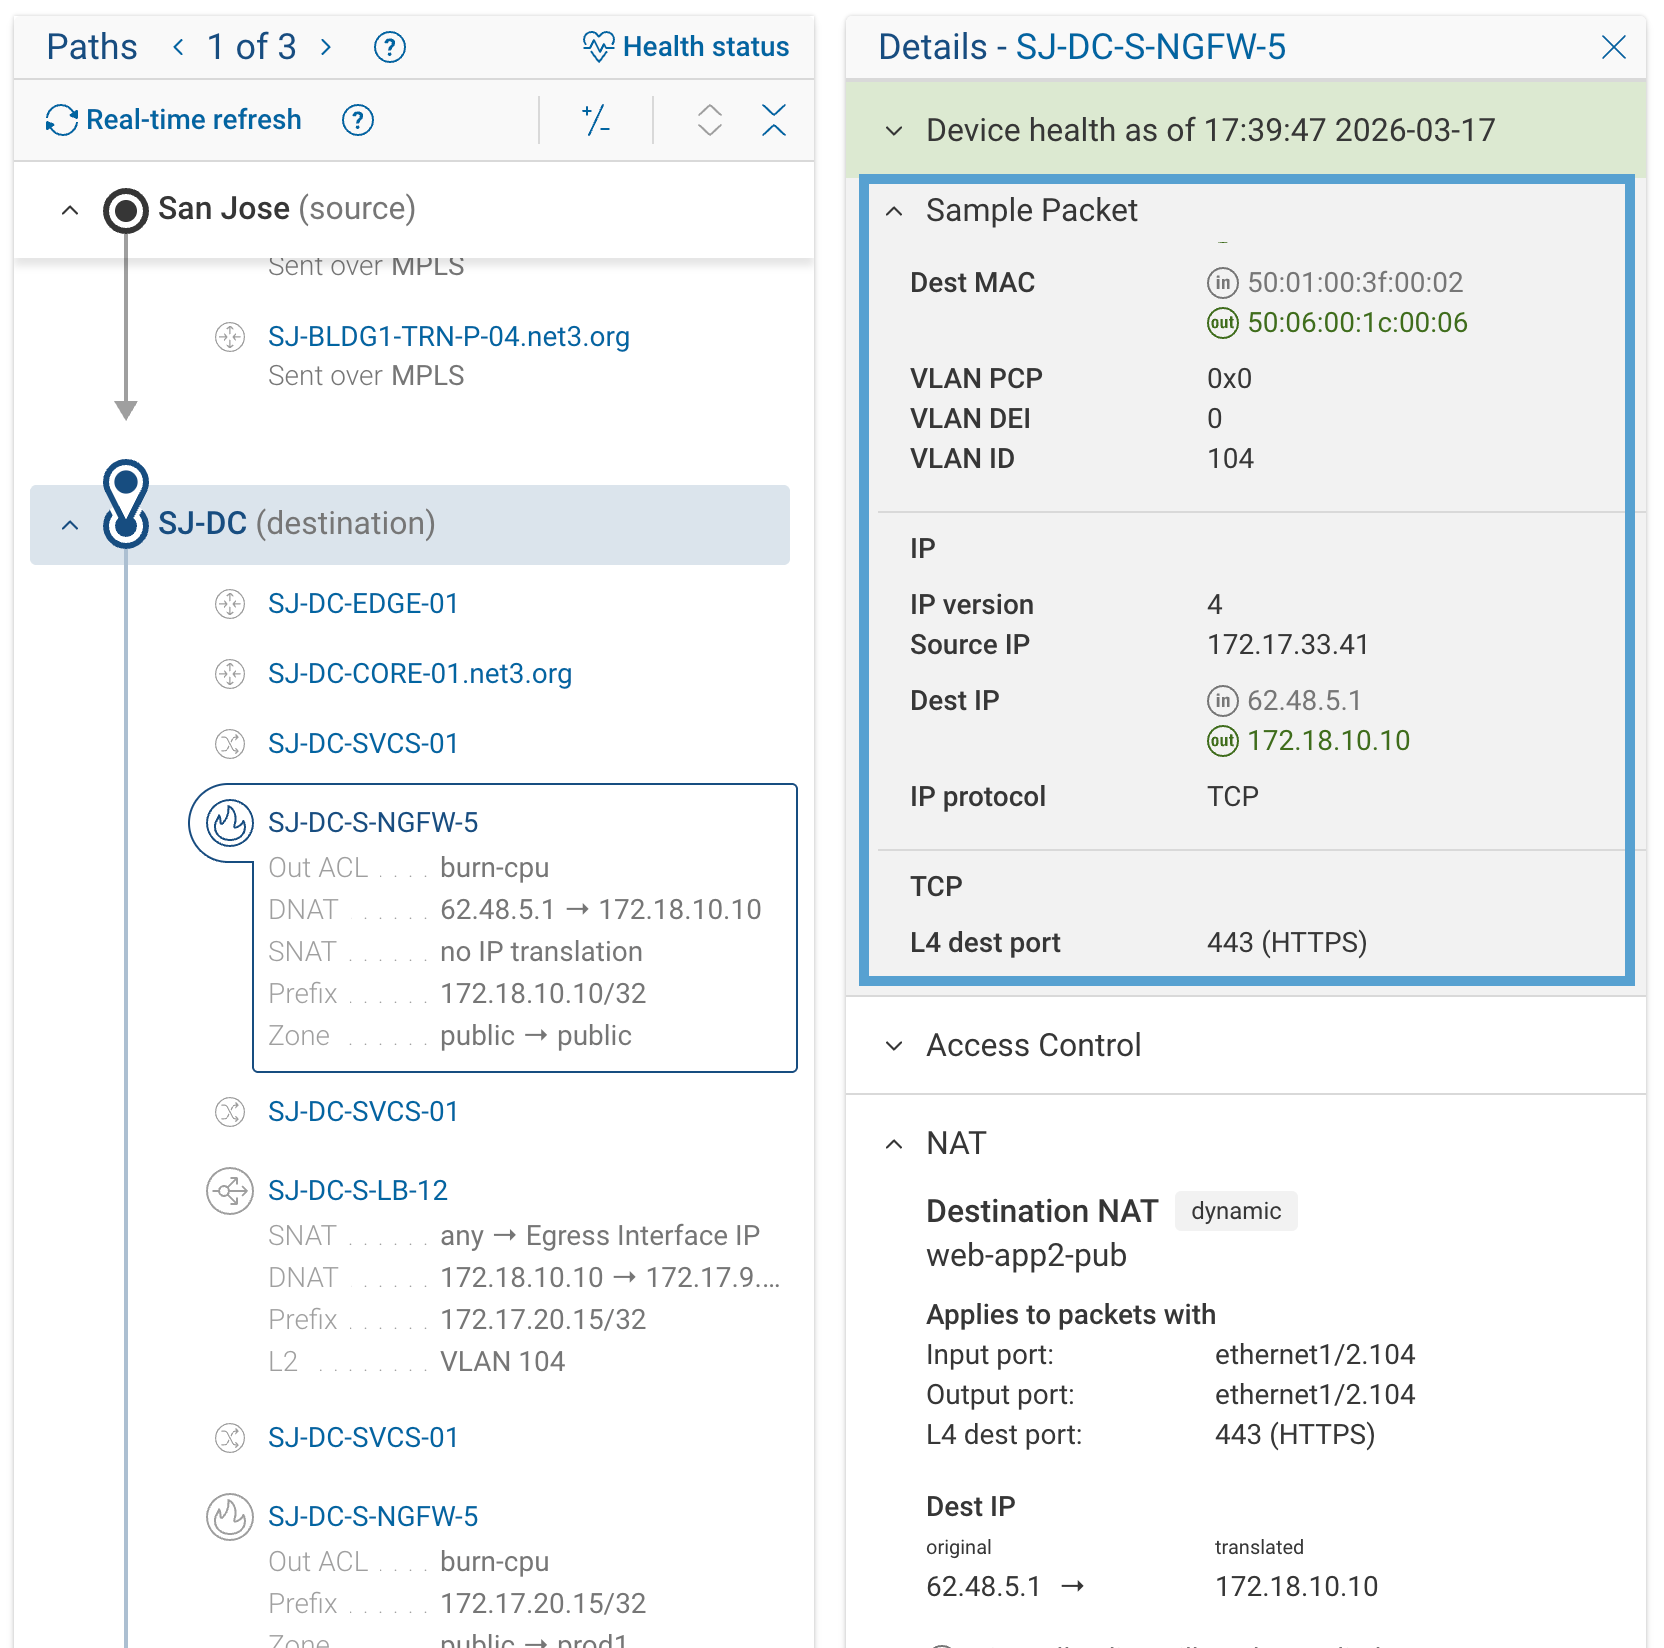
Each header field shows a single value when the device leaves it unchanged, and separate in and out values when the device modifies it. This applies to any header Forward models — if a device changes a field at that hop (MAC rewrite, NAT translation, VLAN push/pop, MPLS label operation, or any other header Forward supports now or in the future), the change is reflected as an in/out pair.
The sample packet is illustrative: one concrete packet that exercises the selected path. For how sample packets are chosen, see The Sample Packet.
Security Mode
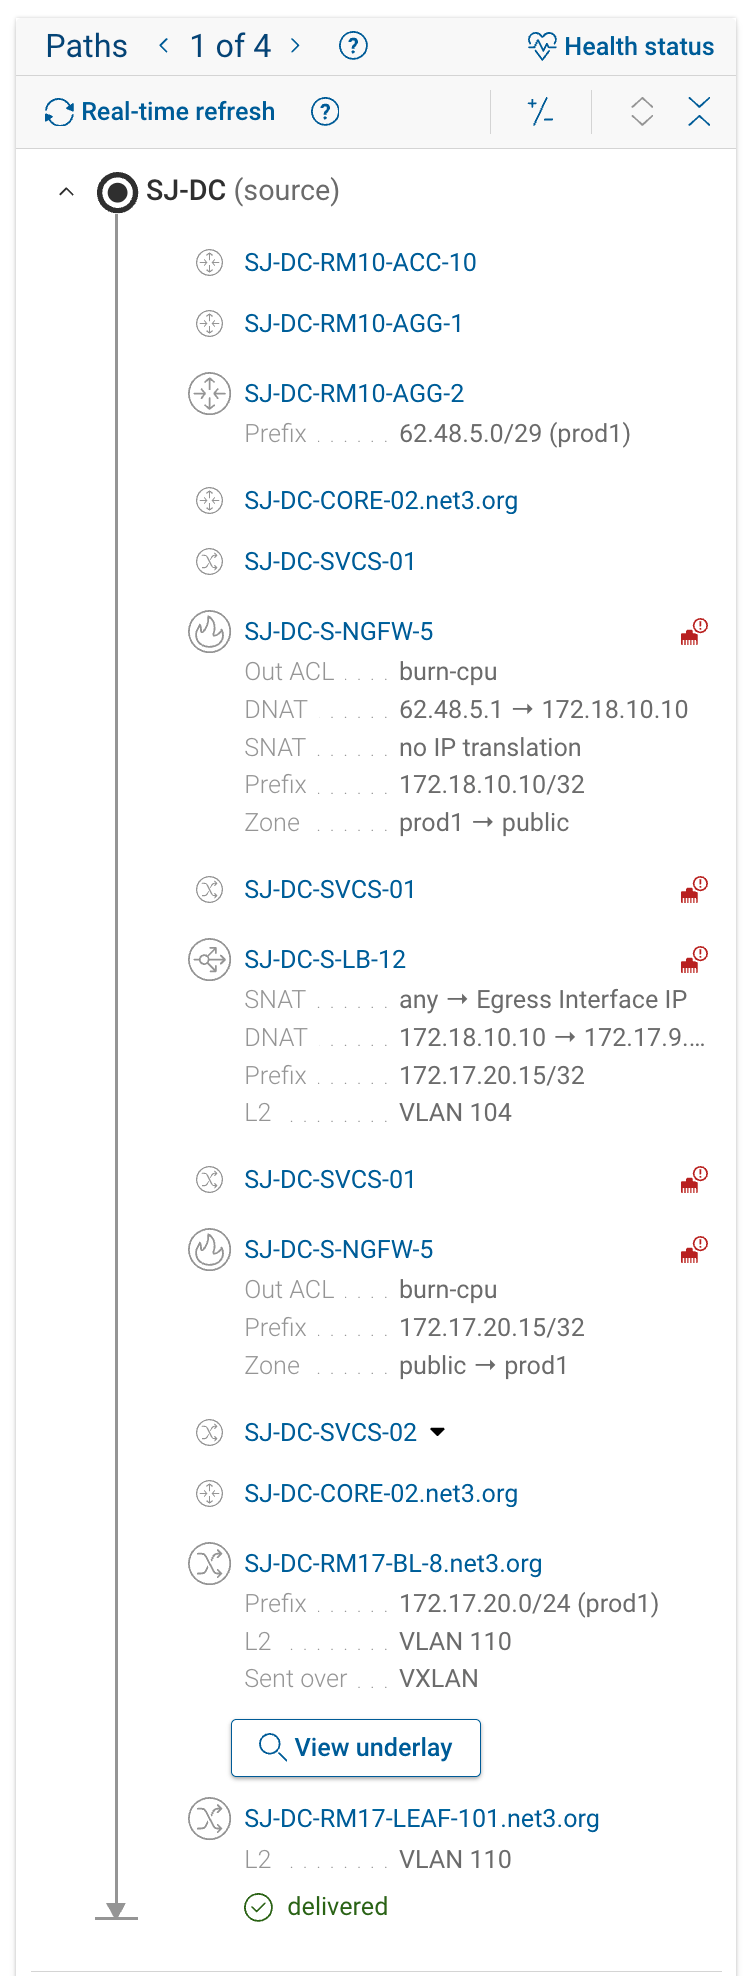
Security mode hides pure forwarding hops and leaves only the devices where security-relevant decisions happen: ACLs, firewall rules, and NAT. Use it to confirm traffic passes through the expected firewall, to find the device that dropped a flow, or to audit policy enforcement across a long path.
| Security mode off | Security mode on |
|---|---|
 | 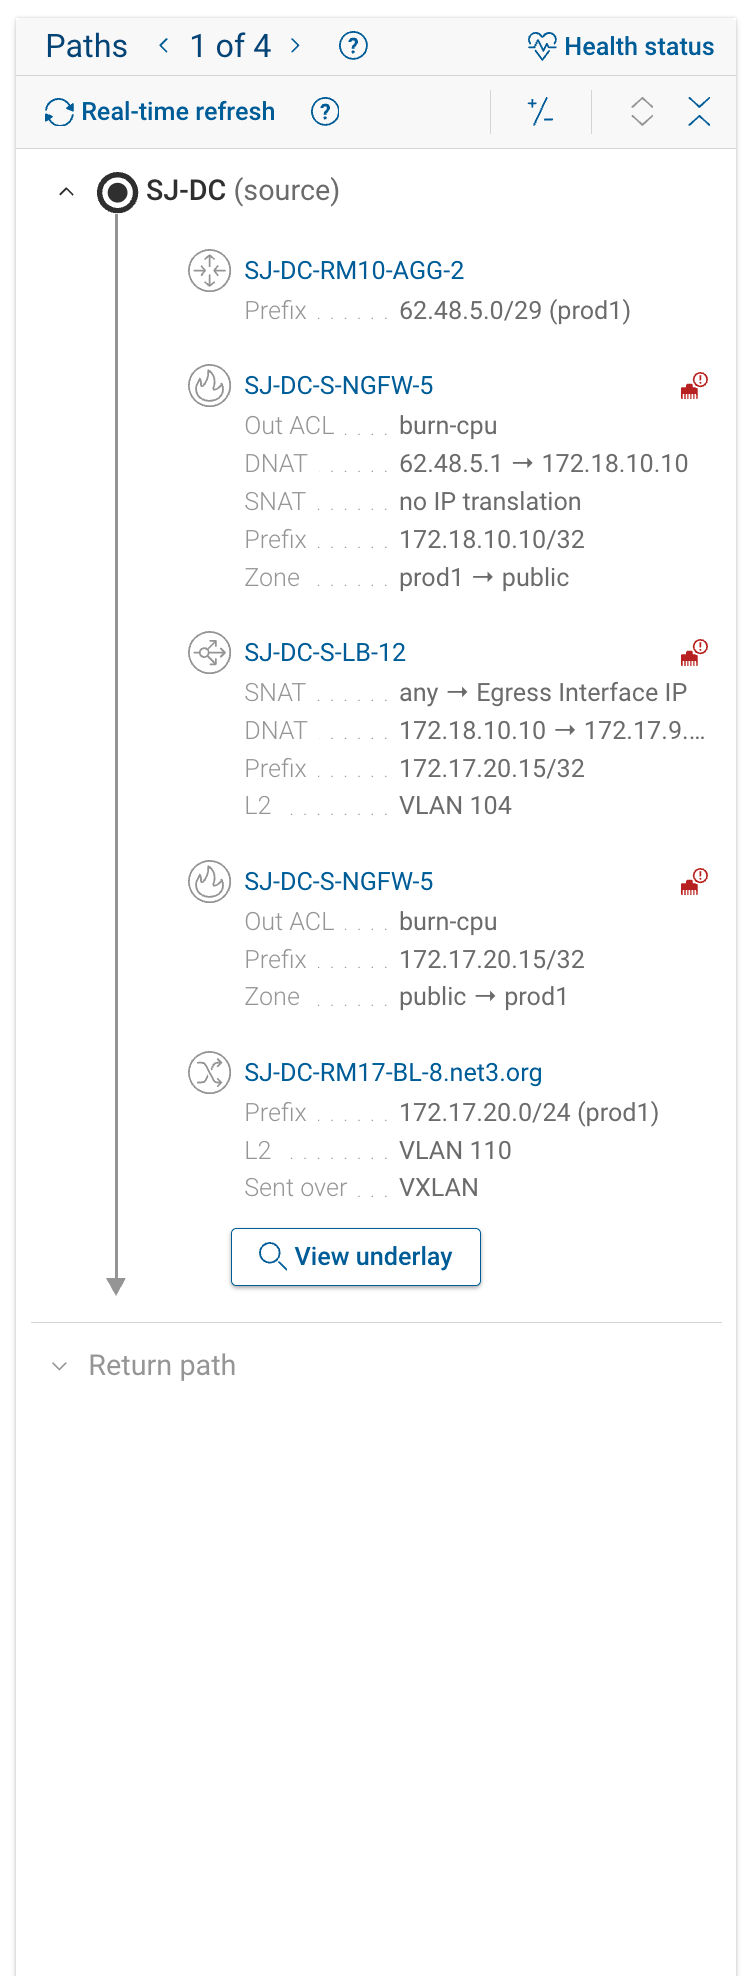 |
Overlay and Underlay Paths
When traffic enters a tunnel modeled as a tunnel interface (VXLAN, GRE, IPsec, GENEVE, and similar), the primary path shows the overlay (logical) view and the underlay (physical transport) is available separately. VXLAN is the case you'll see most often. MPLS is not included: label-switched paths are shown inline as individual hops carrying an MPLS link label, not as an overlay/underlay split, so they have no underlay to drill into.
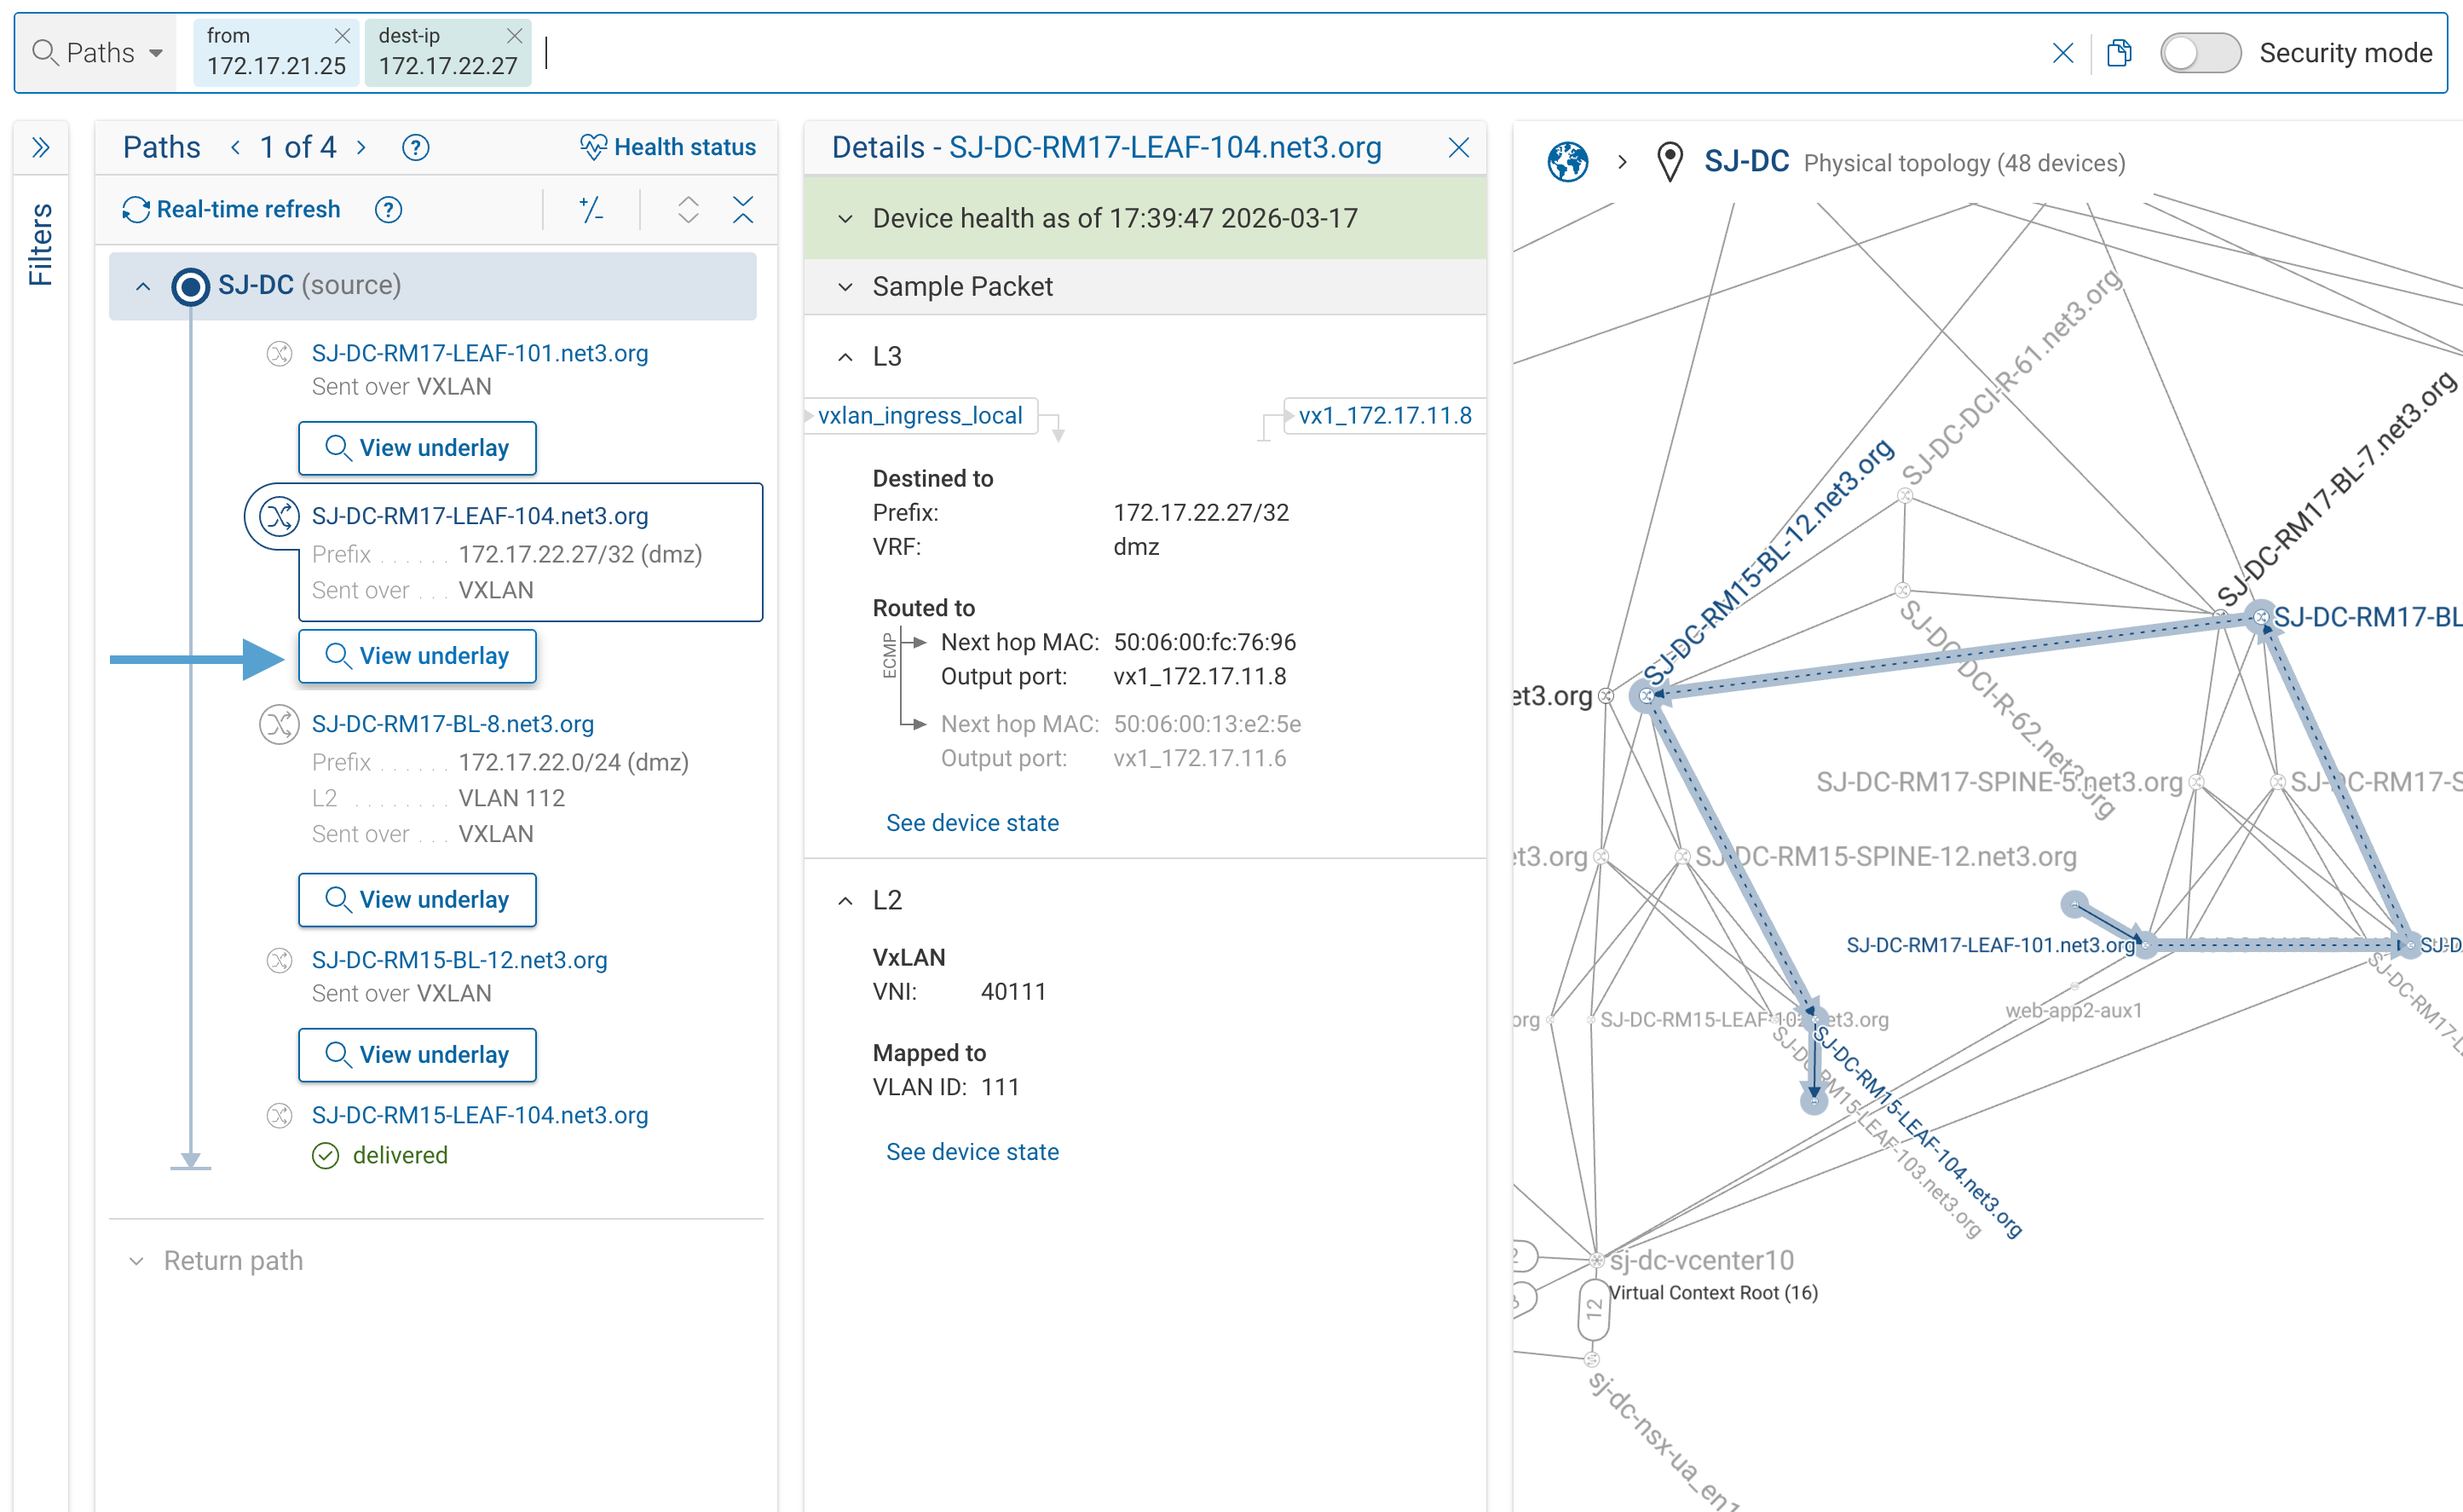
Click View underlay on a tunnel hop to drill into the physical path carrying that tunnel. The overlay and underlay are separate path searches, each with its own sample packet — there is no combined inner+outer view in a single packet display:
- The overlay sample packet shows the inner (original) headers — the source/destination as the application sees them, with the tunnel link traversed as one logical hop.
- The underlay sample packet shows the transport headers — the outer IP/UDP between the tunnel endpoints, plus an encapsulation header group (a VXLAN group, for example) when the tunnel adds one.
The Sample Packet panel at each hop shows that hop's ingress and egress header values, so you read the packet's transformation device by device rather than as a stacked inner-over-outer packet.
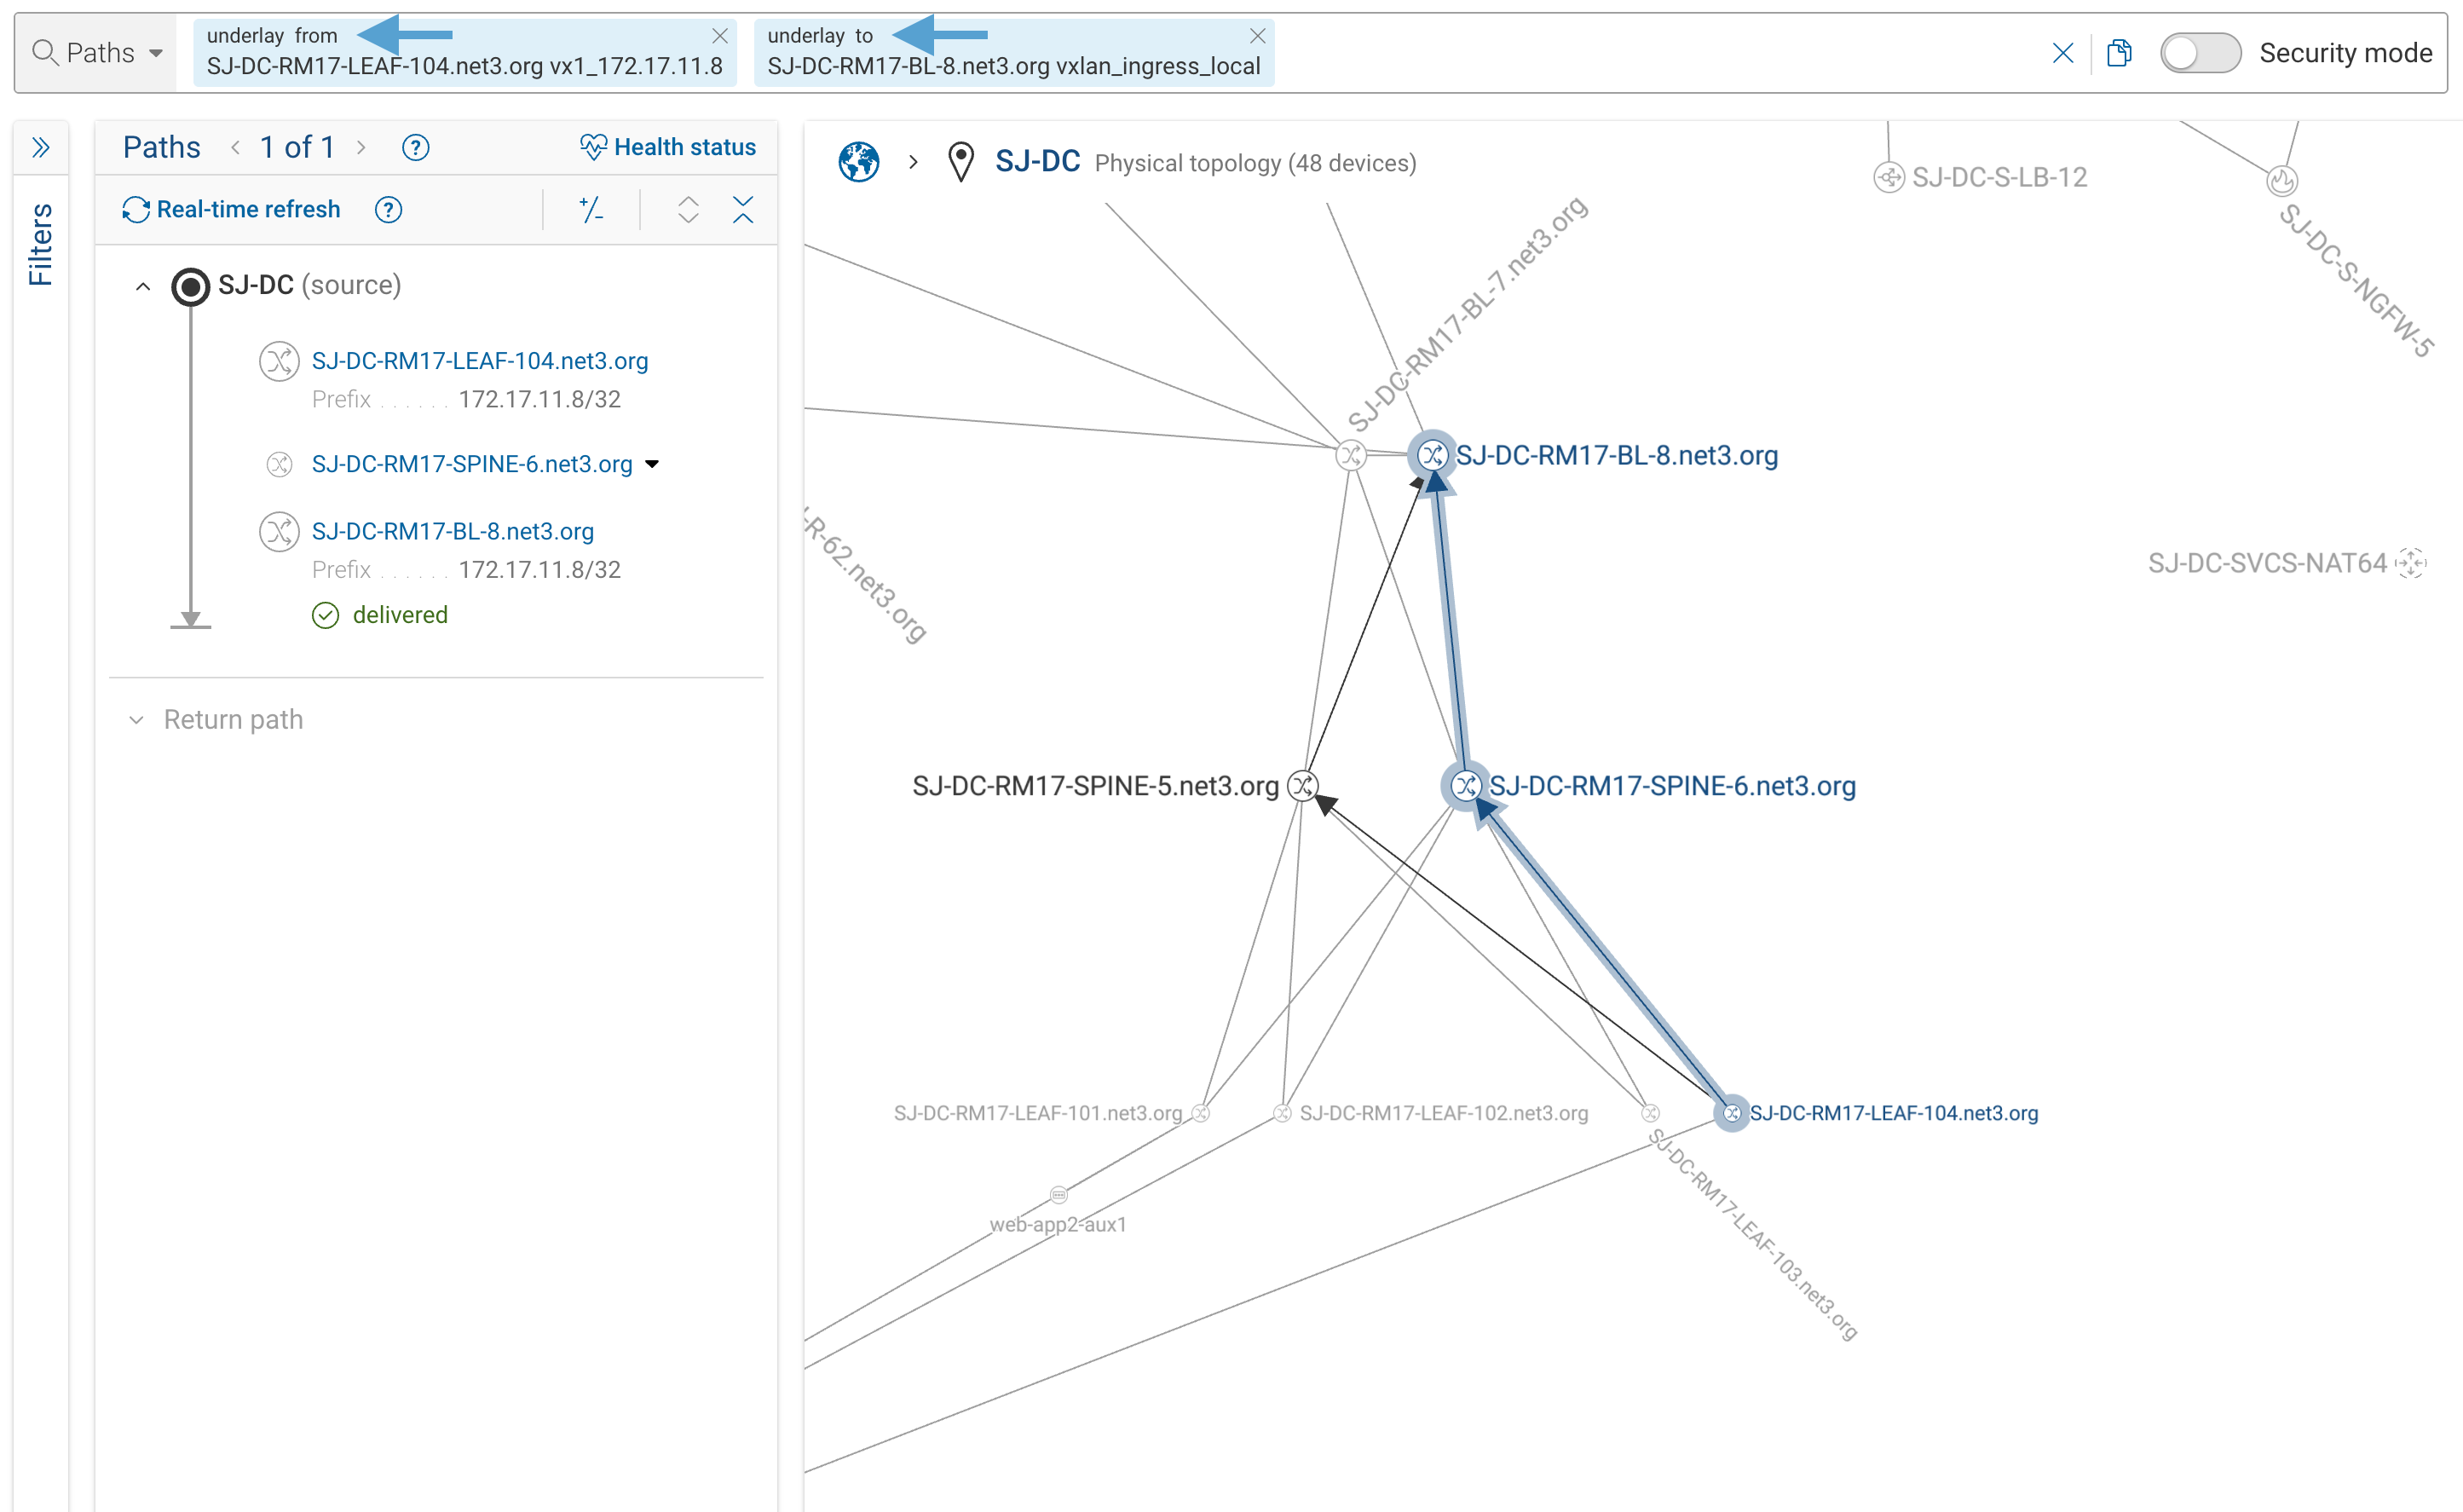
Switching between the two tells you whether the overlay takes the physical route you expected, and whether a failure is in the logical path or in the transport beneath it.
Return Path
For bidirectional analysis, results include a return path showing how response traffic flows from the destination back to the source. It is rendered with the same hop diagram, hop detail panel, and sample packet display as the forward path. The panel is collapsed by default and is computed only for a delivered forward path; expand it to run the return search. Use it to spot asymmetric routing or cases where the forward path is delivered but the return fails.
The return path is a real, independent search — not the forward path replayed in reverse. Forward seeds it from the packet as it arrived at the destination (after any NAT), swaps source and destination, then searches back toward the source through each device's own routing and policy. Because it is its own search, it can take a different route than the forward path and can be dropped by return-direction policy even when the forward path was delivered.
For example, a forward query that is source-NAT'd on the way out:
from(10.1.10.15) to(203.0.113.10)        forward: client 10.1.10.15 → server 203.0.113.10,
                                          SNAT to 198.51.100.7 at the edge firewall
The destination receives the packet as 198.51.100.7 → 203.0.113.10. The return path is seeded from that header and
reversed:
                                          return: 203.0.113.10 → 198.51.100.7,
                                          REVERSE_SNAT at the firewall restores the
                                          original 10.1.10.15
Source and destination IPs, MAC addresses, and L4 ports are swapped; TCP SYN becomes SYN-ACK and ICMP echo requests
become echo replies. As the return traverses the network it hits the inverse NAT functions (REVERSE_SNAT,
REVERSE_DNAT, and so on), so the original client addressing is restored by the time the response reaches the source.
Path Diff
Path diff compares the same query across two snapshots, highlighting how routing, policy, or outcomes changed between them.
- Run a path search in the current snapshot
- Click the Path diffs button in the results controls to open the diff panel
- In the panel, use Compare to to pick the other snapshot; Forward runs the query against both and shows them side by side

The diff tags each element relative to the snapshot you are viewing versus the one you compared against. Tags read as full words (present, absent, modified) on path locations, and as single-letter badges (p, a, m) on devices and VPC entries:
| Tag | Badge | Meaning |
|---|---|---|
present | p | In the compared snapshot but not the one you are viewing |
absent | a | In the snapshot you are viewing but not the compared one |
modified | m | Present in both, but the device's behavior changed (route, policy, outcome) |
An element with no tag is unchanged: the same device with the same behavior in both snapshots. Hover a badge for the full description.
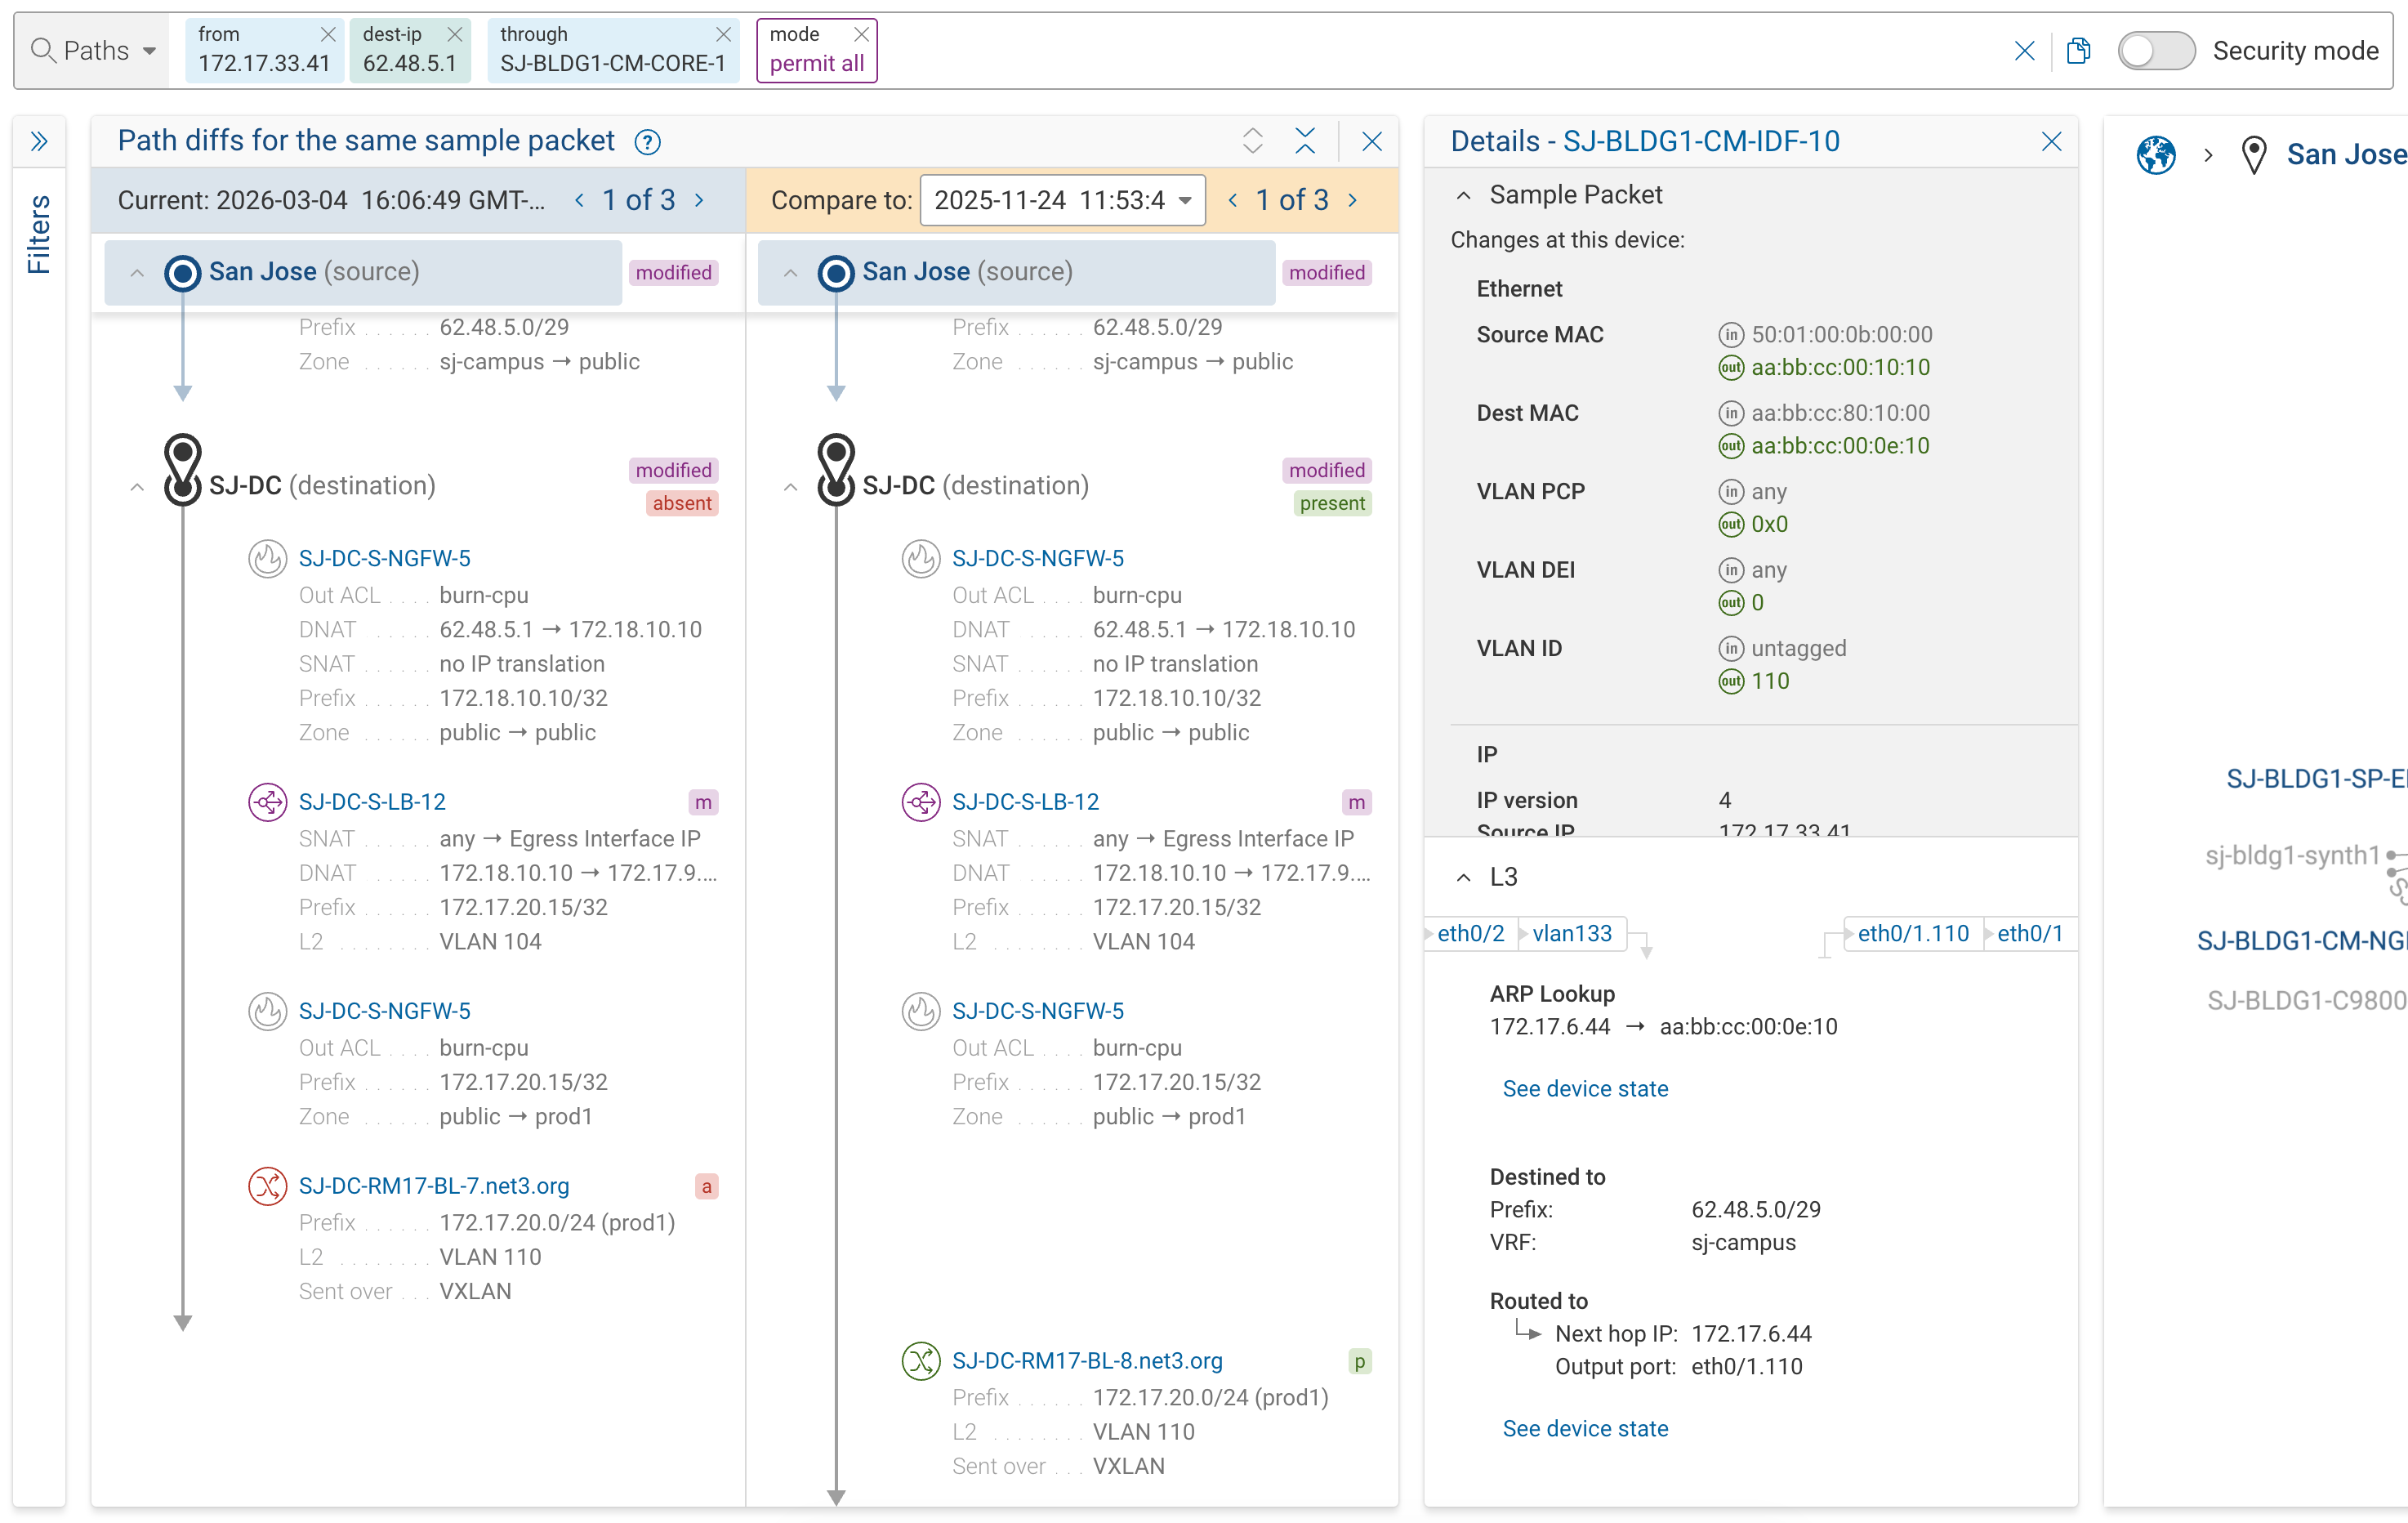
Use path diff to confirm a planned change had the intended effect, or to isolate a regression when traffic that was previously delivered is now dropped.
Incomplete Results
Searches are bounded by a result cap and a timeout (default 30 seconds, configurable up to 5 minutes). When either is hit, the result set is a subset of matching paths — not wrong, but not exhaustive.

Truncation is signaled by a + on the path-group counter (e.g., "Path group 1 of 5+") with an explanatory tooltip.
To get complete results, narrow the query: add filters, constrain the destination, or add positional anchors such as
through() or ingress().
Incomplete results may omit entire outcomes or path variants. When completeness matters — most often for security validation — refine the query until the truncation indicator is gone.
Missing Devices
If a path transits a device that was not collected in the snapshot, a banner reports that one or more devices are missing from the collection. The model has a gap at those points, and real traffic may behave differently than what the results show.
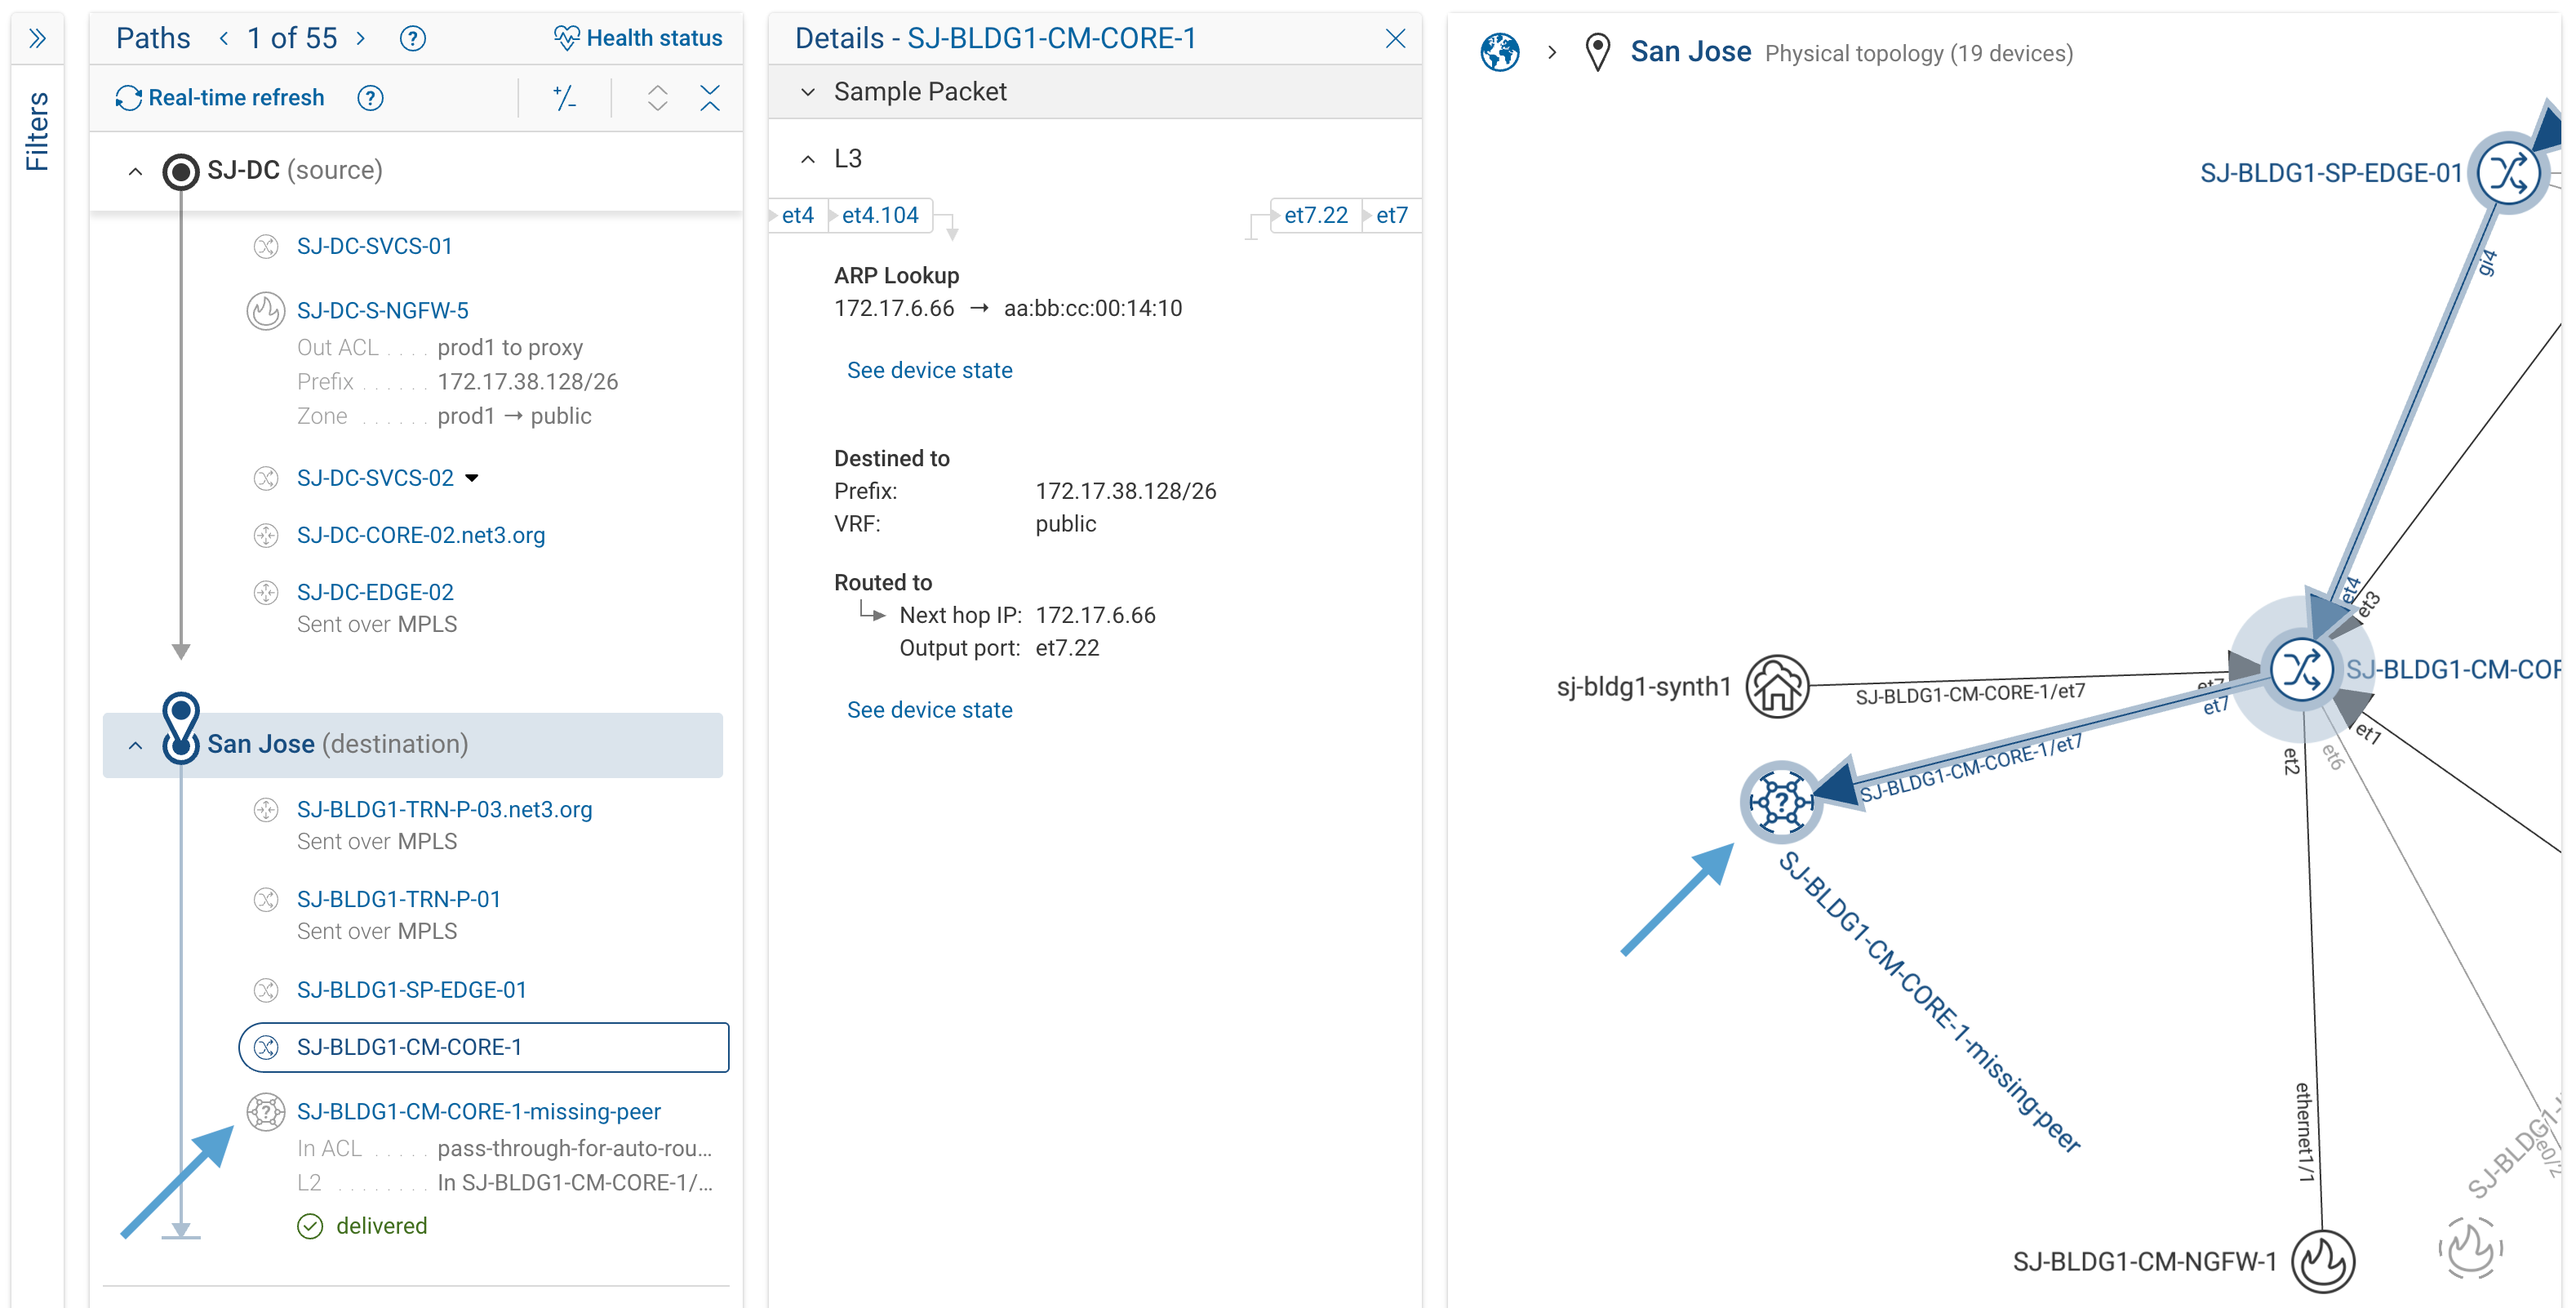
When an uncollected device sits mid-path, the result stops at that device even if the devices beyond it are fully modeled. Once traffic leaves a modeled device toward an unknown one, Forward has no way to tell where (or whether) it re-enters the modeled network, so downstream hops are not reconstructed. Collecting the missing device closes the gap.
When the gap is infrastructure you can't collect from — an ISP backbone, or a transport service that exposes only part of its network — collecting the device isn't an option. Model the transit with a synthetic device instead, so the path continues across the gap and re-enters your modeled network on the far side. Use an Internet Node for transit over the public internet, an Intranet Node or L3 VPN for a leased L3 service, and Missing Peer to absorb traffic the other synthetic devices don't account for.
Parsing Errors
If a device in the path was collected but its configuration or state could not be fully parsed, a banner reports that one or more devices have parsing failures. Hops on affected devices carry a warning icon. Analysis involving these devices may be inaccurate — the model reflects only what Forward was able to parse.
For how to investigate and resolve parsing failures, see Troubleshooting & FAQ.
Exporting a Support Bundle
When working with Forward Support on a path-search issue, you can export a snapshot that contains only the devices involved in the current results.
Hold Alt (Windows/Linux) or Option (macOS) over the search bar. The copy icon on the right turns into a download icon. Click it to open the Export Query dialog, which lists the query, the devices in the covered topology, and an Extra devices to include field. Optionally enable Obfuscate IP and MAC addresses with a secret key, then click Export to generate the snapshot.
If the path's return traffic is also relevant, expand the Return path and select a hop on it before triggering the export so its devices are included.
How to Read a Result
- Covered topology — confirm traffic reaches the parts of the network you expected
- Path groups — note how many there are and which outcomes appear
- Open the most relevant group (typically delivered or dropped)
- Walk the hops — read the network functions to see routing and policy decisions
- Check the sample packet — confirm headers and transformations match expectations
- Follow See device state when a decision looks wrong, to jump to the config that produced it
- Run path diff when investigating a change, to compare against a prior snapshot
Next
- Running Path Analysis — query construction, filters, and common intents
- Troubleshooting & FAQ — symptom-keyed recipes for common result-reading questions
- Reference — full catalog of tokens, outcomes, drop reasons, network functions, and badges
- Overview — core concepts and how Path Analysis fits into the platform