Splunk
Splunk is a software platform that collects, indexes, and analyzes machine data from across an enterprise environment. Organizations commonly use it to consolidate network, security, and operational data in one place for monitoring, alerting, and dashboards.
Forward integrates with Splunk, enabling it to push Forward insights and metrics to Splunk. If your organization manages data in Splunk, this integration allows your admins to access Forward data alongside other data in Splunk. Forward can push three types of data:
- NQE Query results
- NQE Verification check results
- Intent Verification check results
Data is pushed as Splunk events. Each event uses a standard structure, which allows you to search, filter, build dashboards and correlate Forward insights with your network and security data in Splunk.
How It Works
This integration has two parts:
- A Splunk instance is where Forward sends data. It holds the Splunk endpoint, token, and target index.
- A Splunk profile is what Forward sends. It defines the network, the event type, and which results to include.
You add one instance, then add one or more profiles to it. Once a profile is saved, Forward can push data to Splunk in two ways:
- Manual push: you push the data on demand from the profile.
- Automatic push: after each snapshot is processed, Forward pushes the matching data for every enabled profile. This is enabled by default once a profile is saved.
For an NQE query profile, the query runs as part of snapshot processing. Automatic push sends the results from that snapshot.
Prerequisites
Before you start, gather the following from Splunk:
- The HTTP Event Collector (HEC) URL for your Splunk instance.
- An HEC token. Forward uses it to authenticate when pushing data.
- The target index name, if you want data to go to a specific index. This is optional. If you leave it blank, data
goes to the token's default index (usually
main).
Add a Splunk Instance
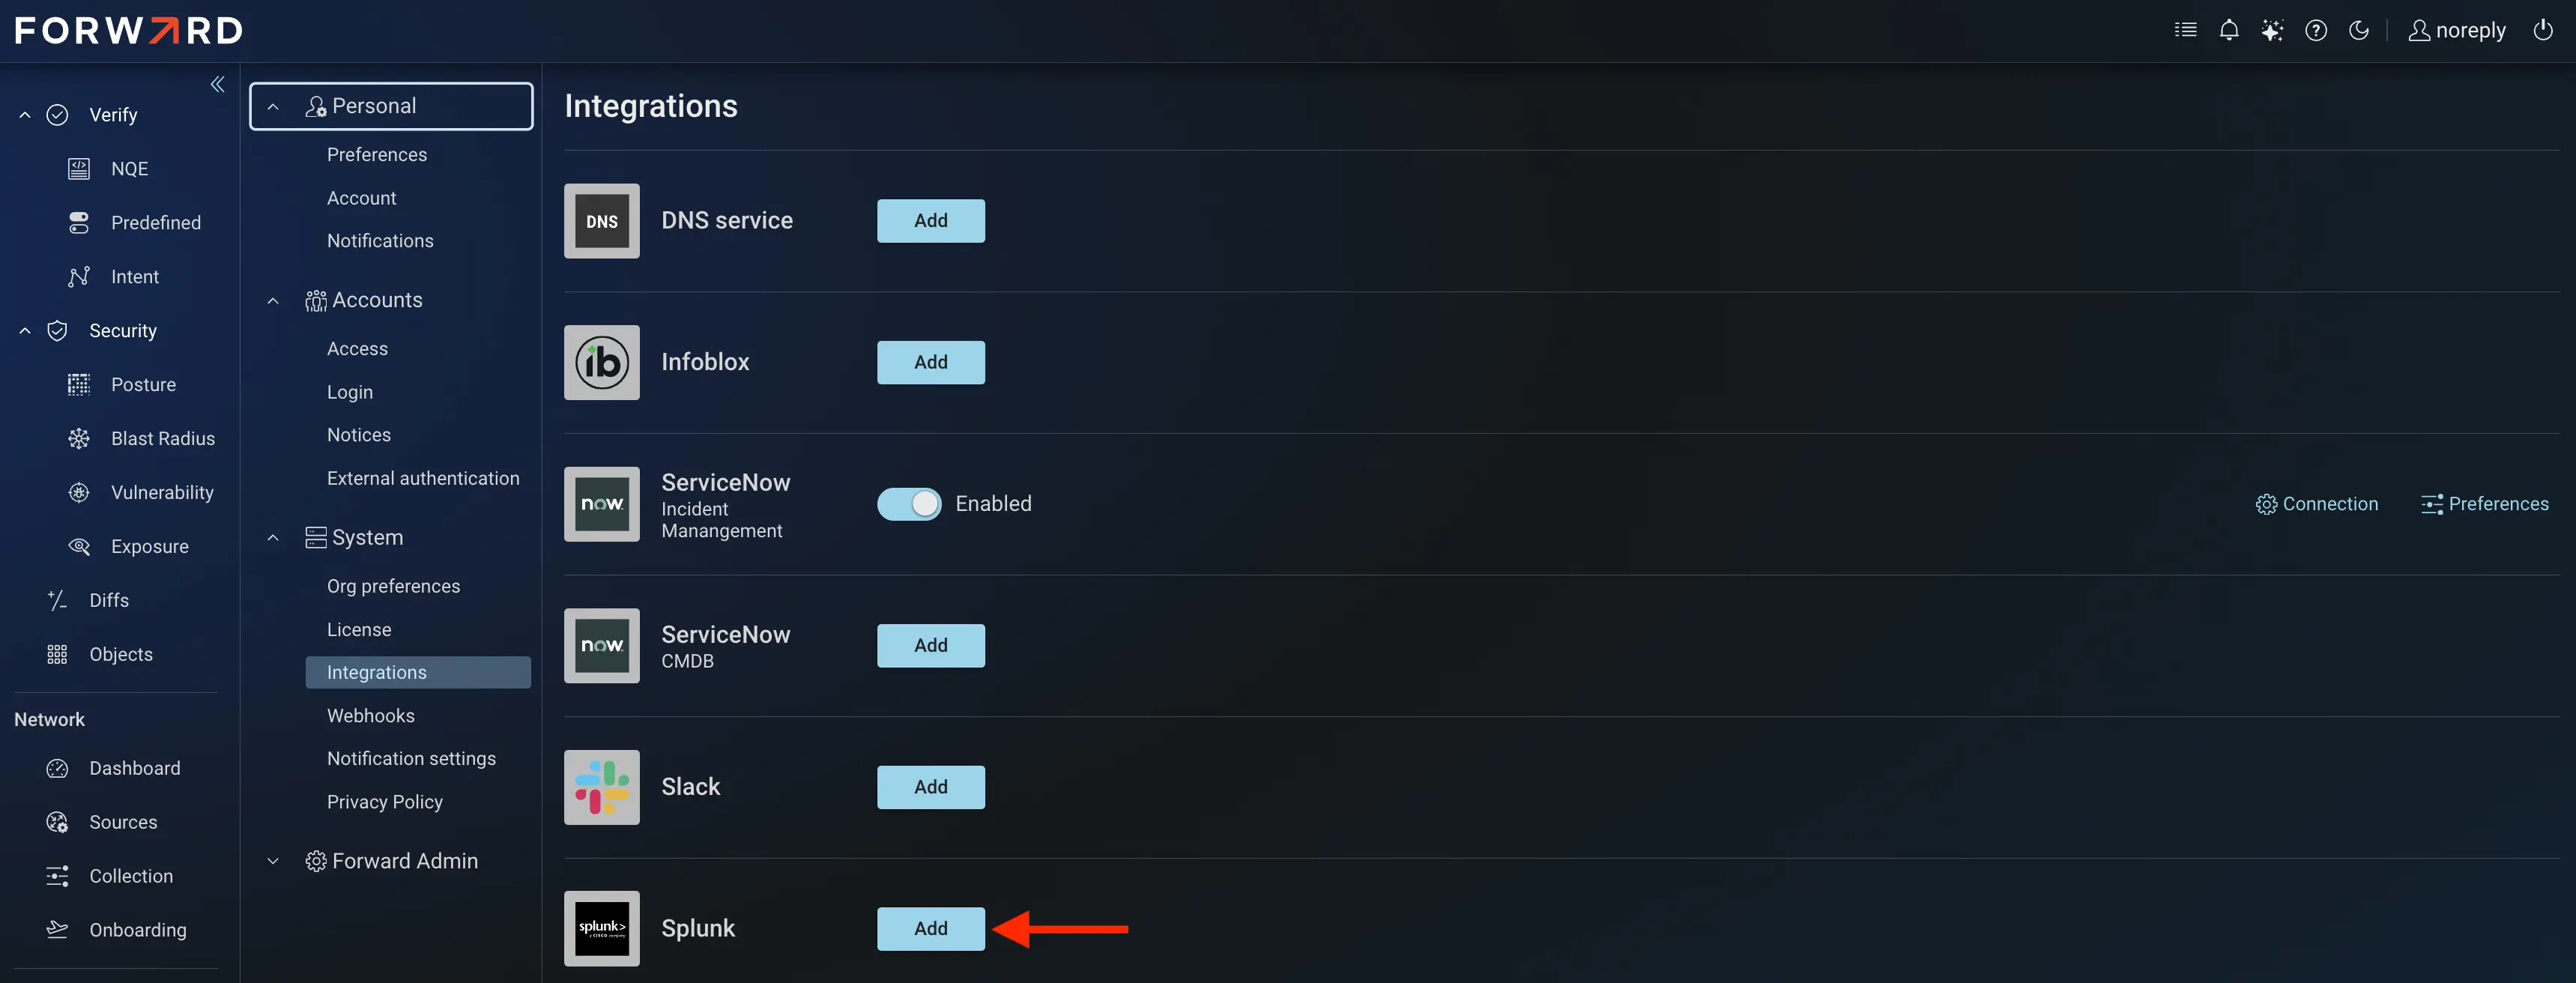
- Navigate to Settings > System > Integrations and look for Splunk.
- Click Add to add a new instance. If one or more instances already exist, the row shows the View Splunk
instances option instead. Click it to view the saved instances or to add another one.
- If this is the first Splunk instance, click New instance. Otherwise, click Add new instance.
- Fill in the instance details:
- Instance name: a name to identify this instance.
- Splunk HEC URL: the HTTP Event Collector URL.
- HEC Token: the token Forward uses to authenticate.
- Select a target index within Splunk to push to: the target index. (Optional)
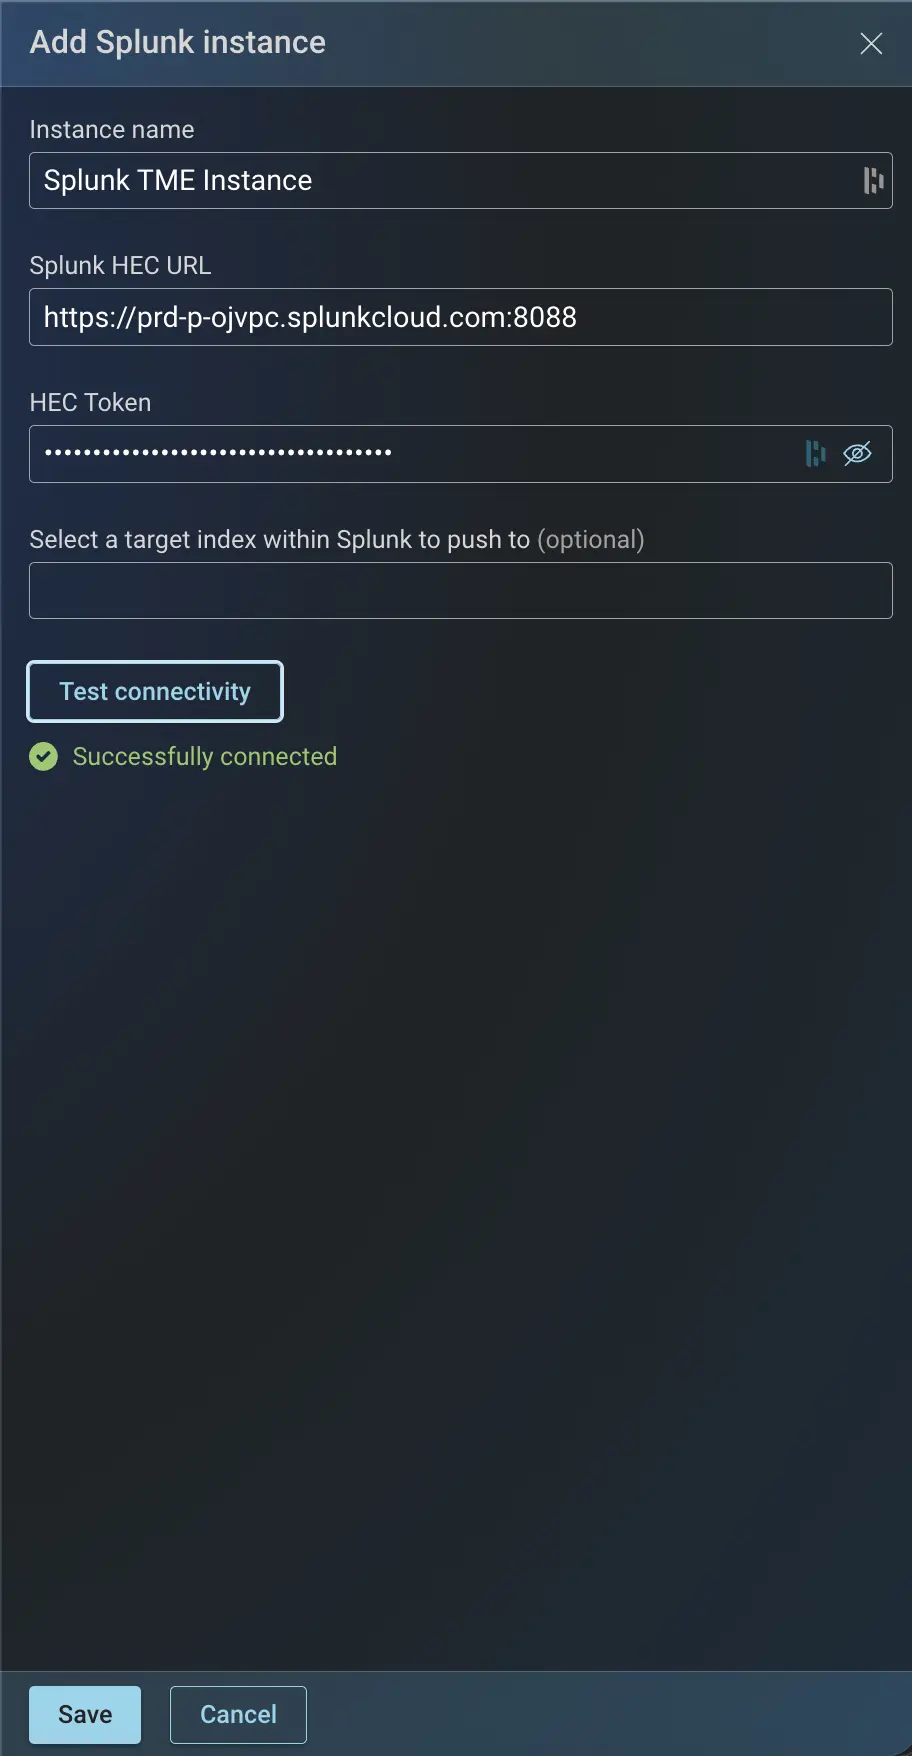
- Click Test connectivity. The test must pass before you can save.
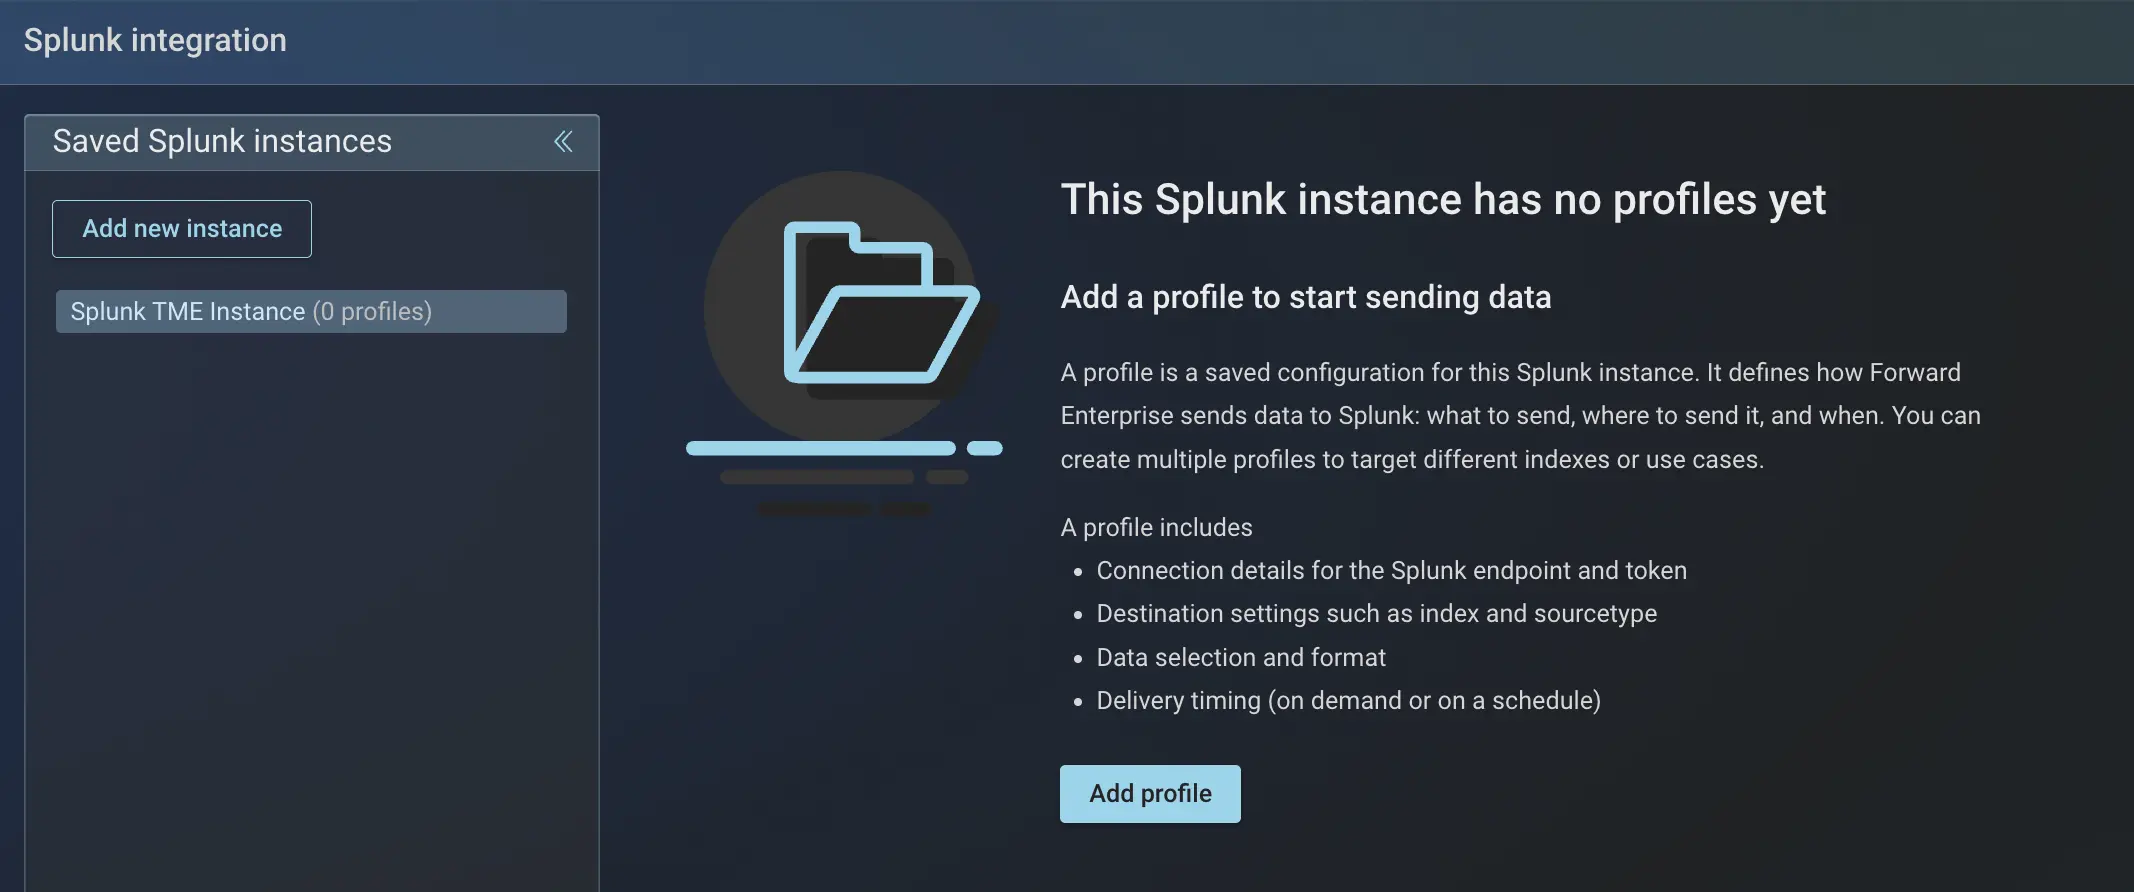
- Click Save and the new instance will be listed under Saved Splunk instances.
Add a Profile
An instance can have multiple profiles. Each profile sends one type of data for one network.
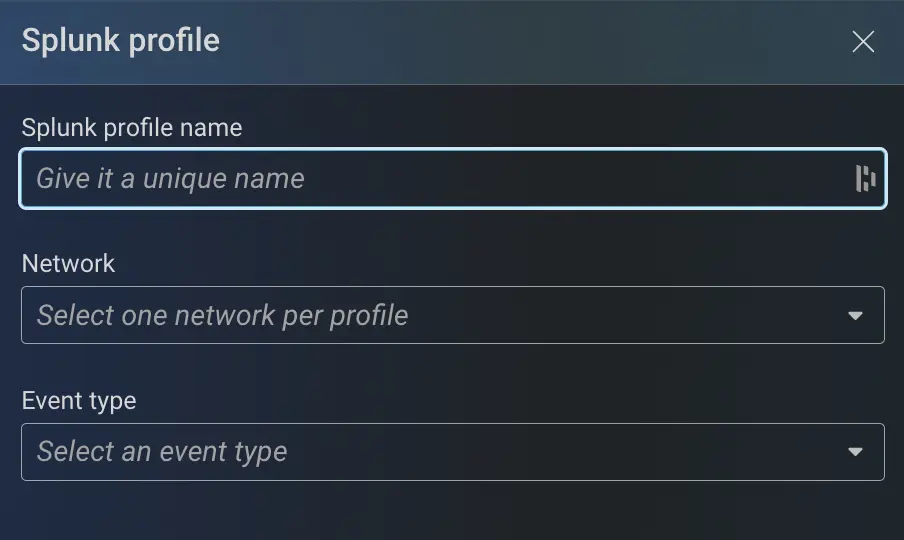
- Select the instance under Saved Splunk instances, then click Add profile, or Add new profile if the instance already has profiles.
- Fill in the profile details:
- Splunk profile name: a unique name for the profile.
- Network: the network to send data from. Each profile uses one network.
- Event type: choose NQE Query, NQE Verification, or Intent Verification.
- Configure the event type details (see below).
- Click Save to add this new profile to the selected Splunk instance.
NQE Query
Select the NQE Query whose results you want to send. Then, under Fields to send, choose which columns to include. Clear the columns you do not want to send. In the example shown, OS and OS Version have been excluded while keeping the rest of the fields.
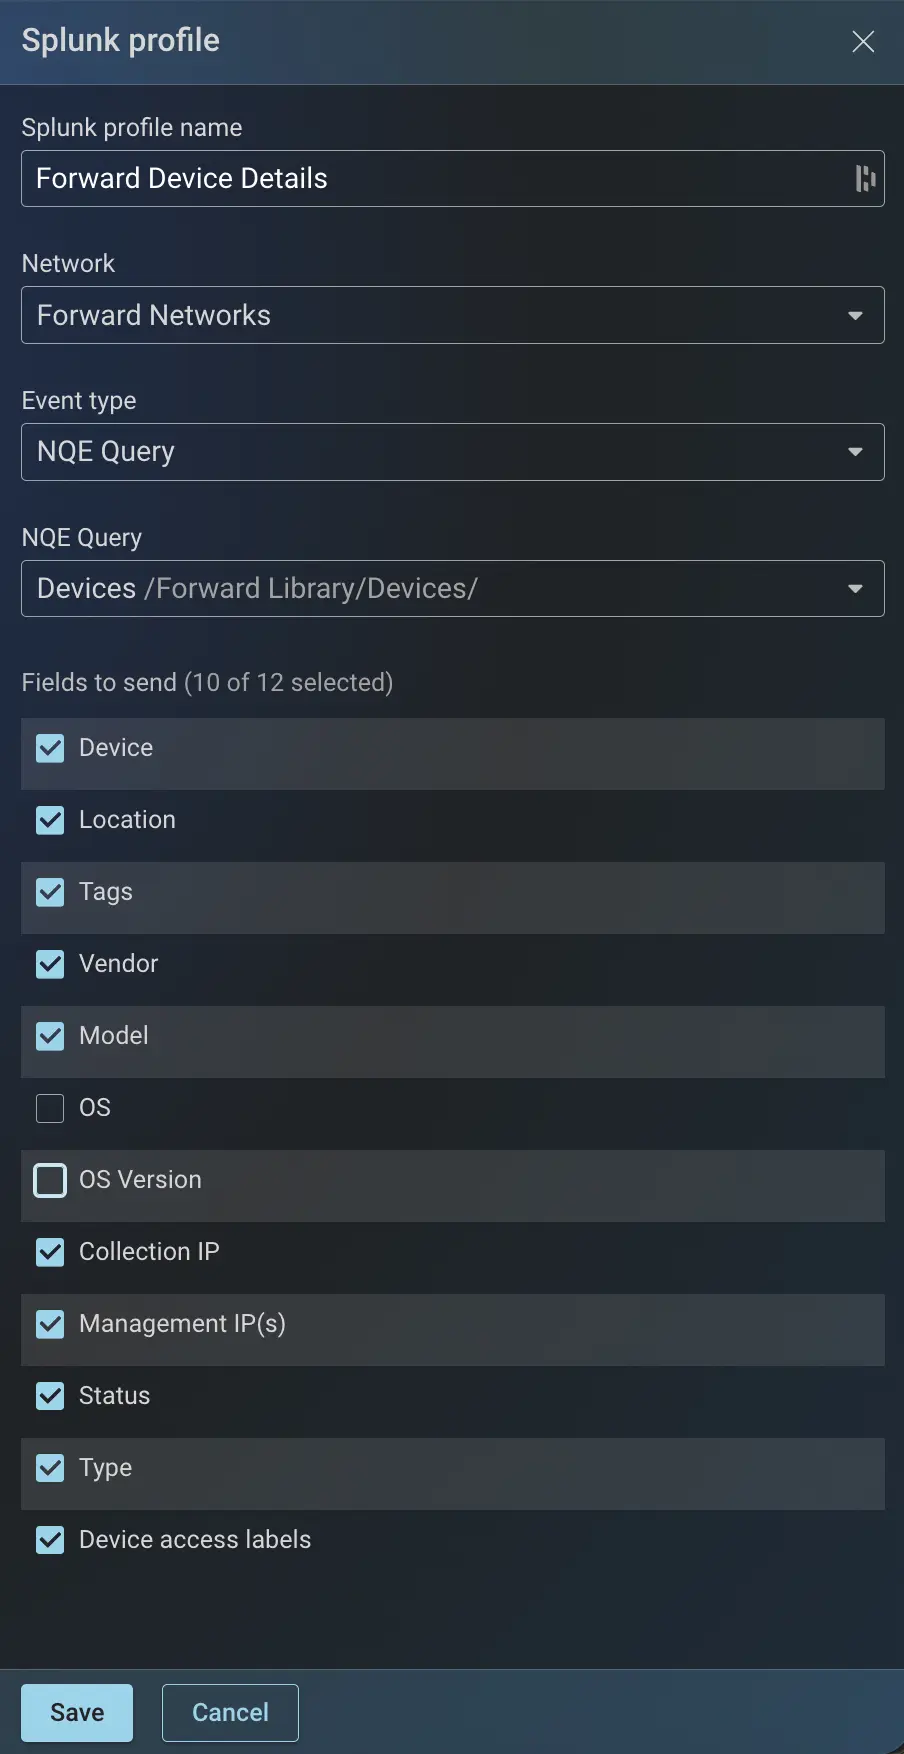
Parameterized queries are not supported because the query runs on each push, with no way to supply parameter values.
NQE Verification
For the NQE Verification event type select an NQE verification directory. Then choose which results to send under Results to send:
- All results: passing and failing results.
- Failures only: only failed results.
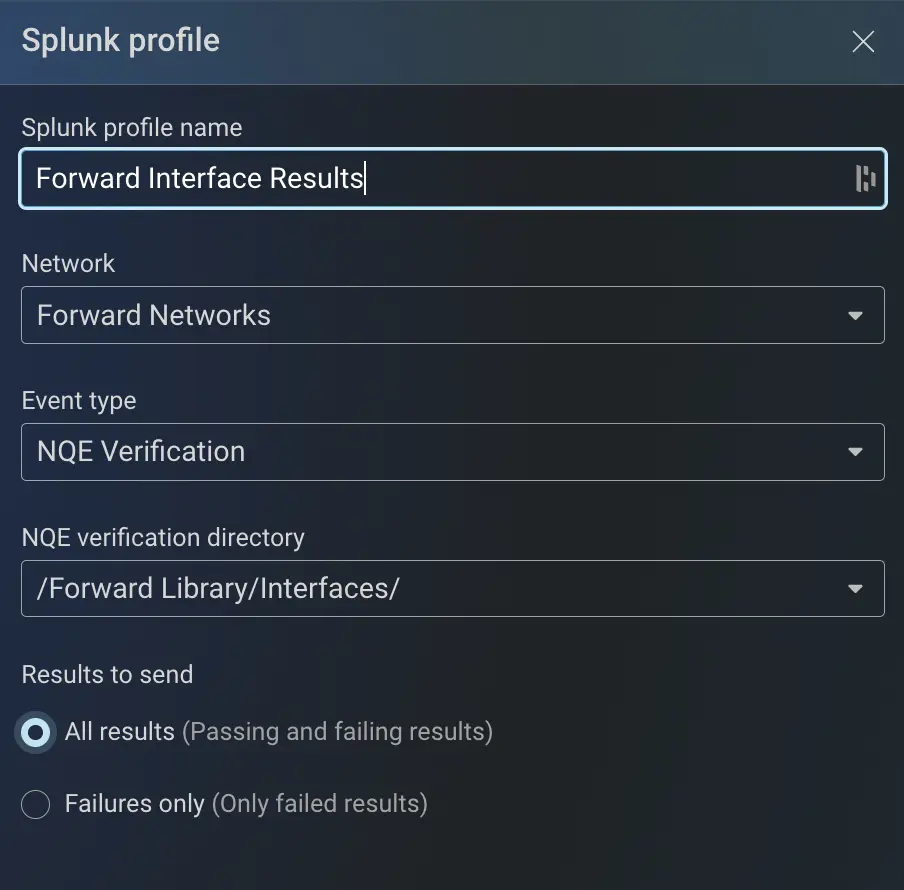
Each profile sends results from one directory.
Intent Verification
For the Intent Verification event type select an Intent verification directory. Then choose All results or Failures only under Results to send, as with NQE Verification.
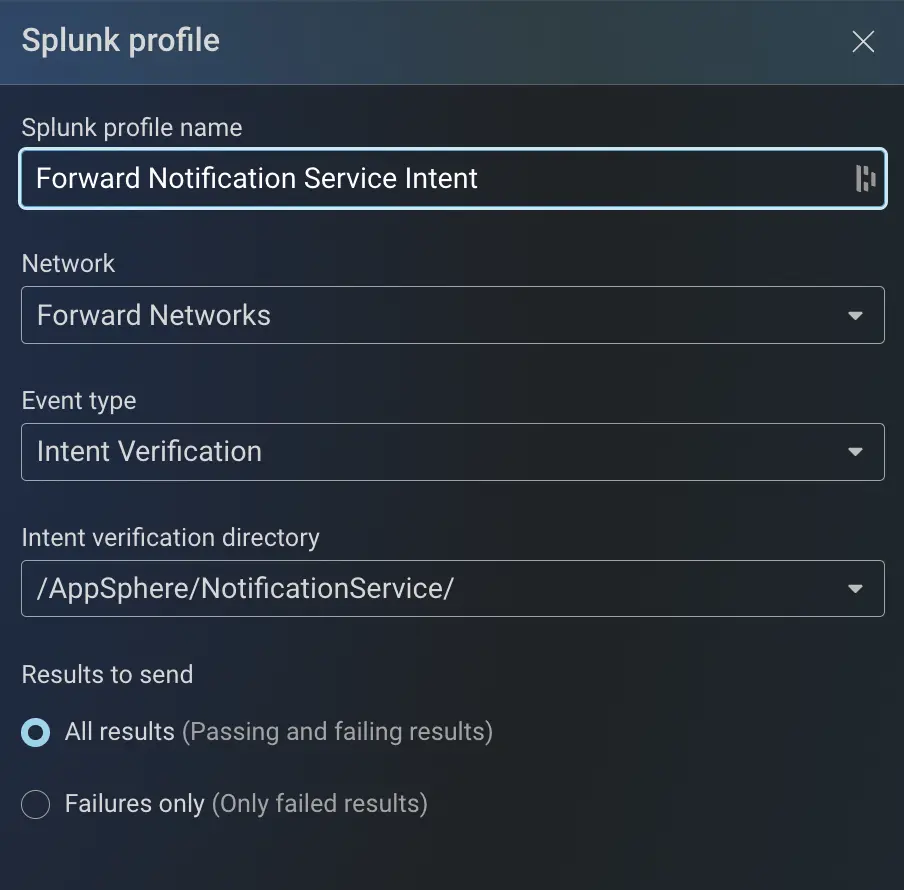
For NQE and Intent verification event types, when you choose Failures only, Forward sends a result only when the check newly fails. This means the check changed from passing to failing, or the check did not exist in the previous snapshot. A check that keeps failing across snapshots is not sent again.
Manage Profiles
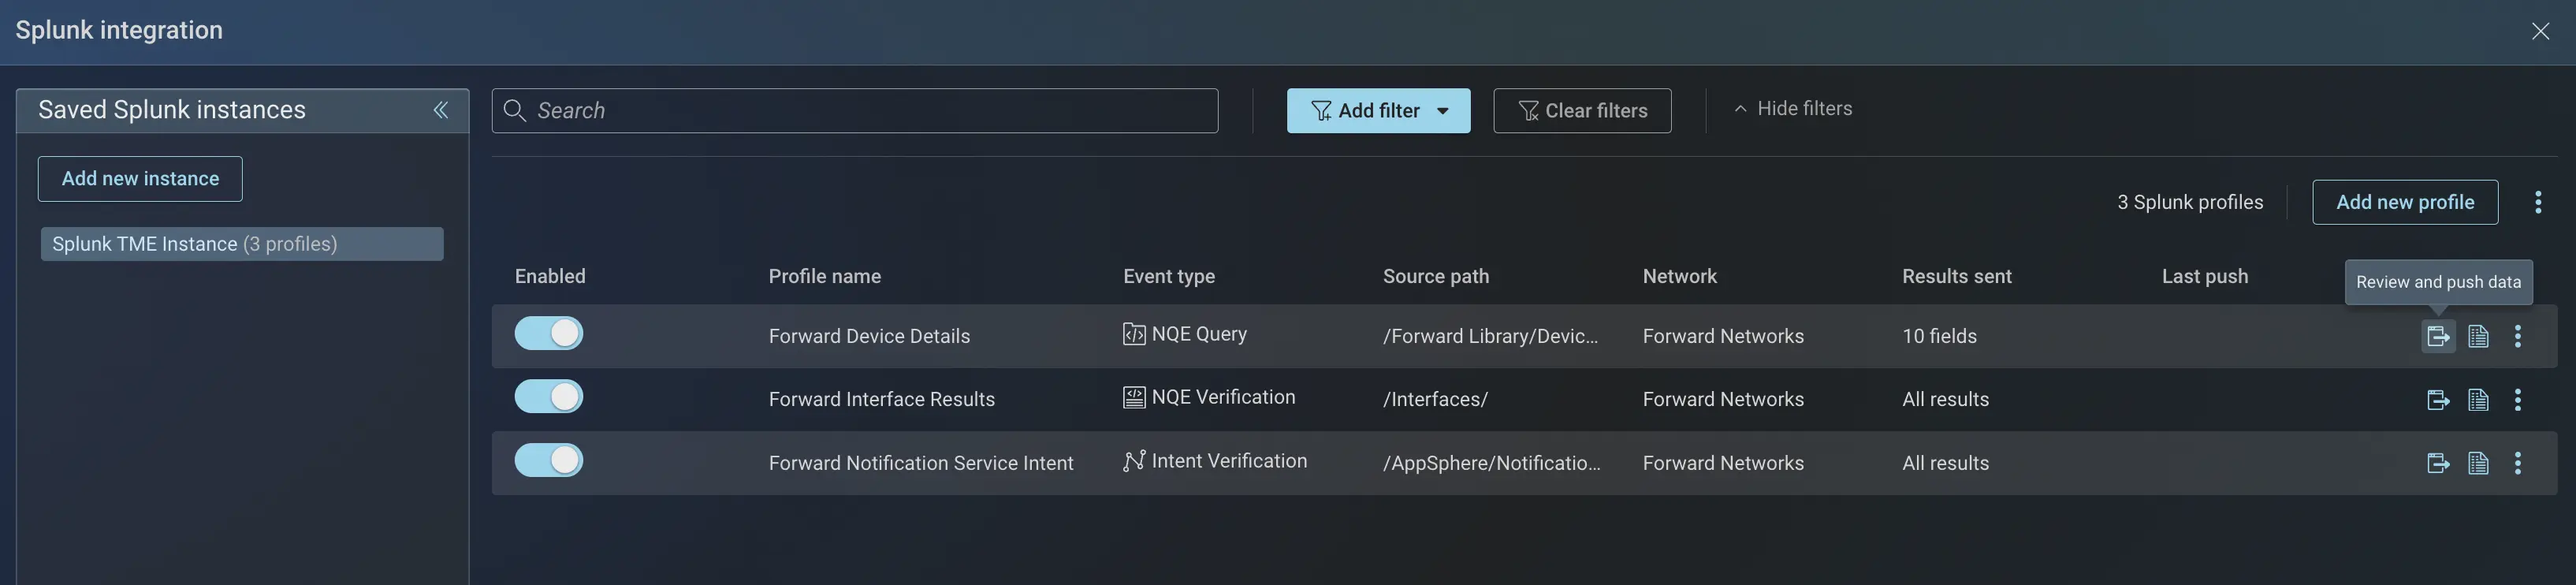
The profiles you add are listed under the selected Splunk instance. Each profile row has Review and push data and View logs actions, and a 3-dot menu with options to Edit and Delete that profile.
Preview the Data
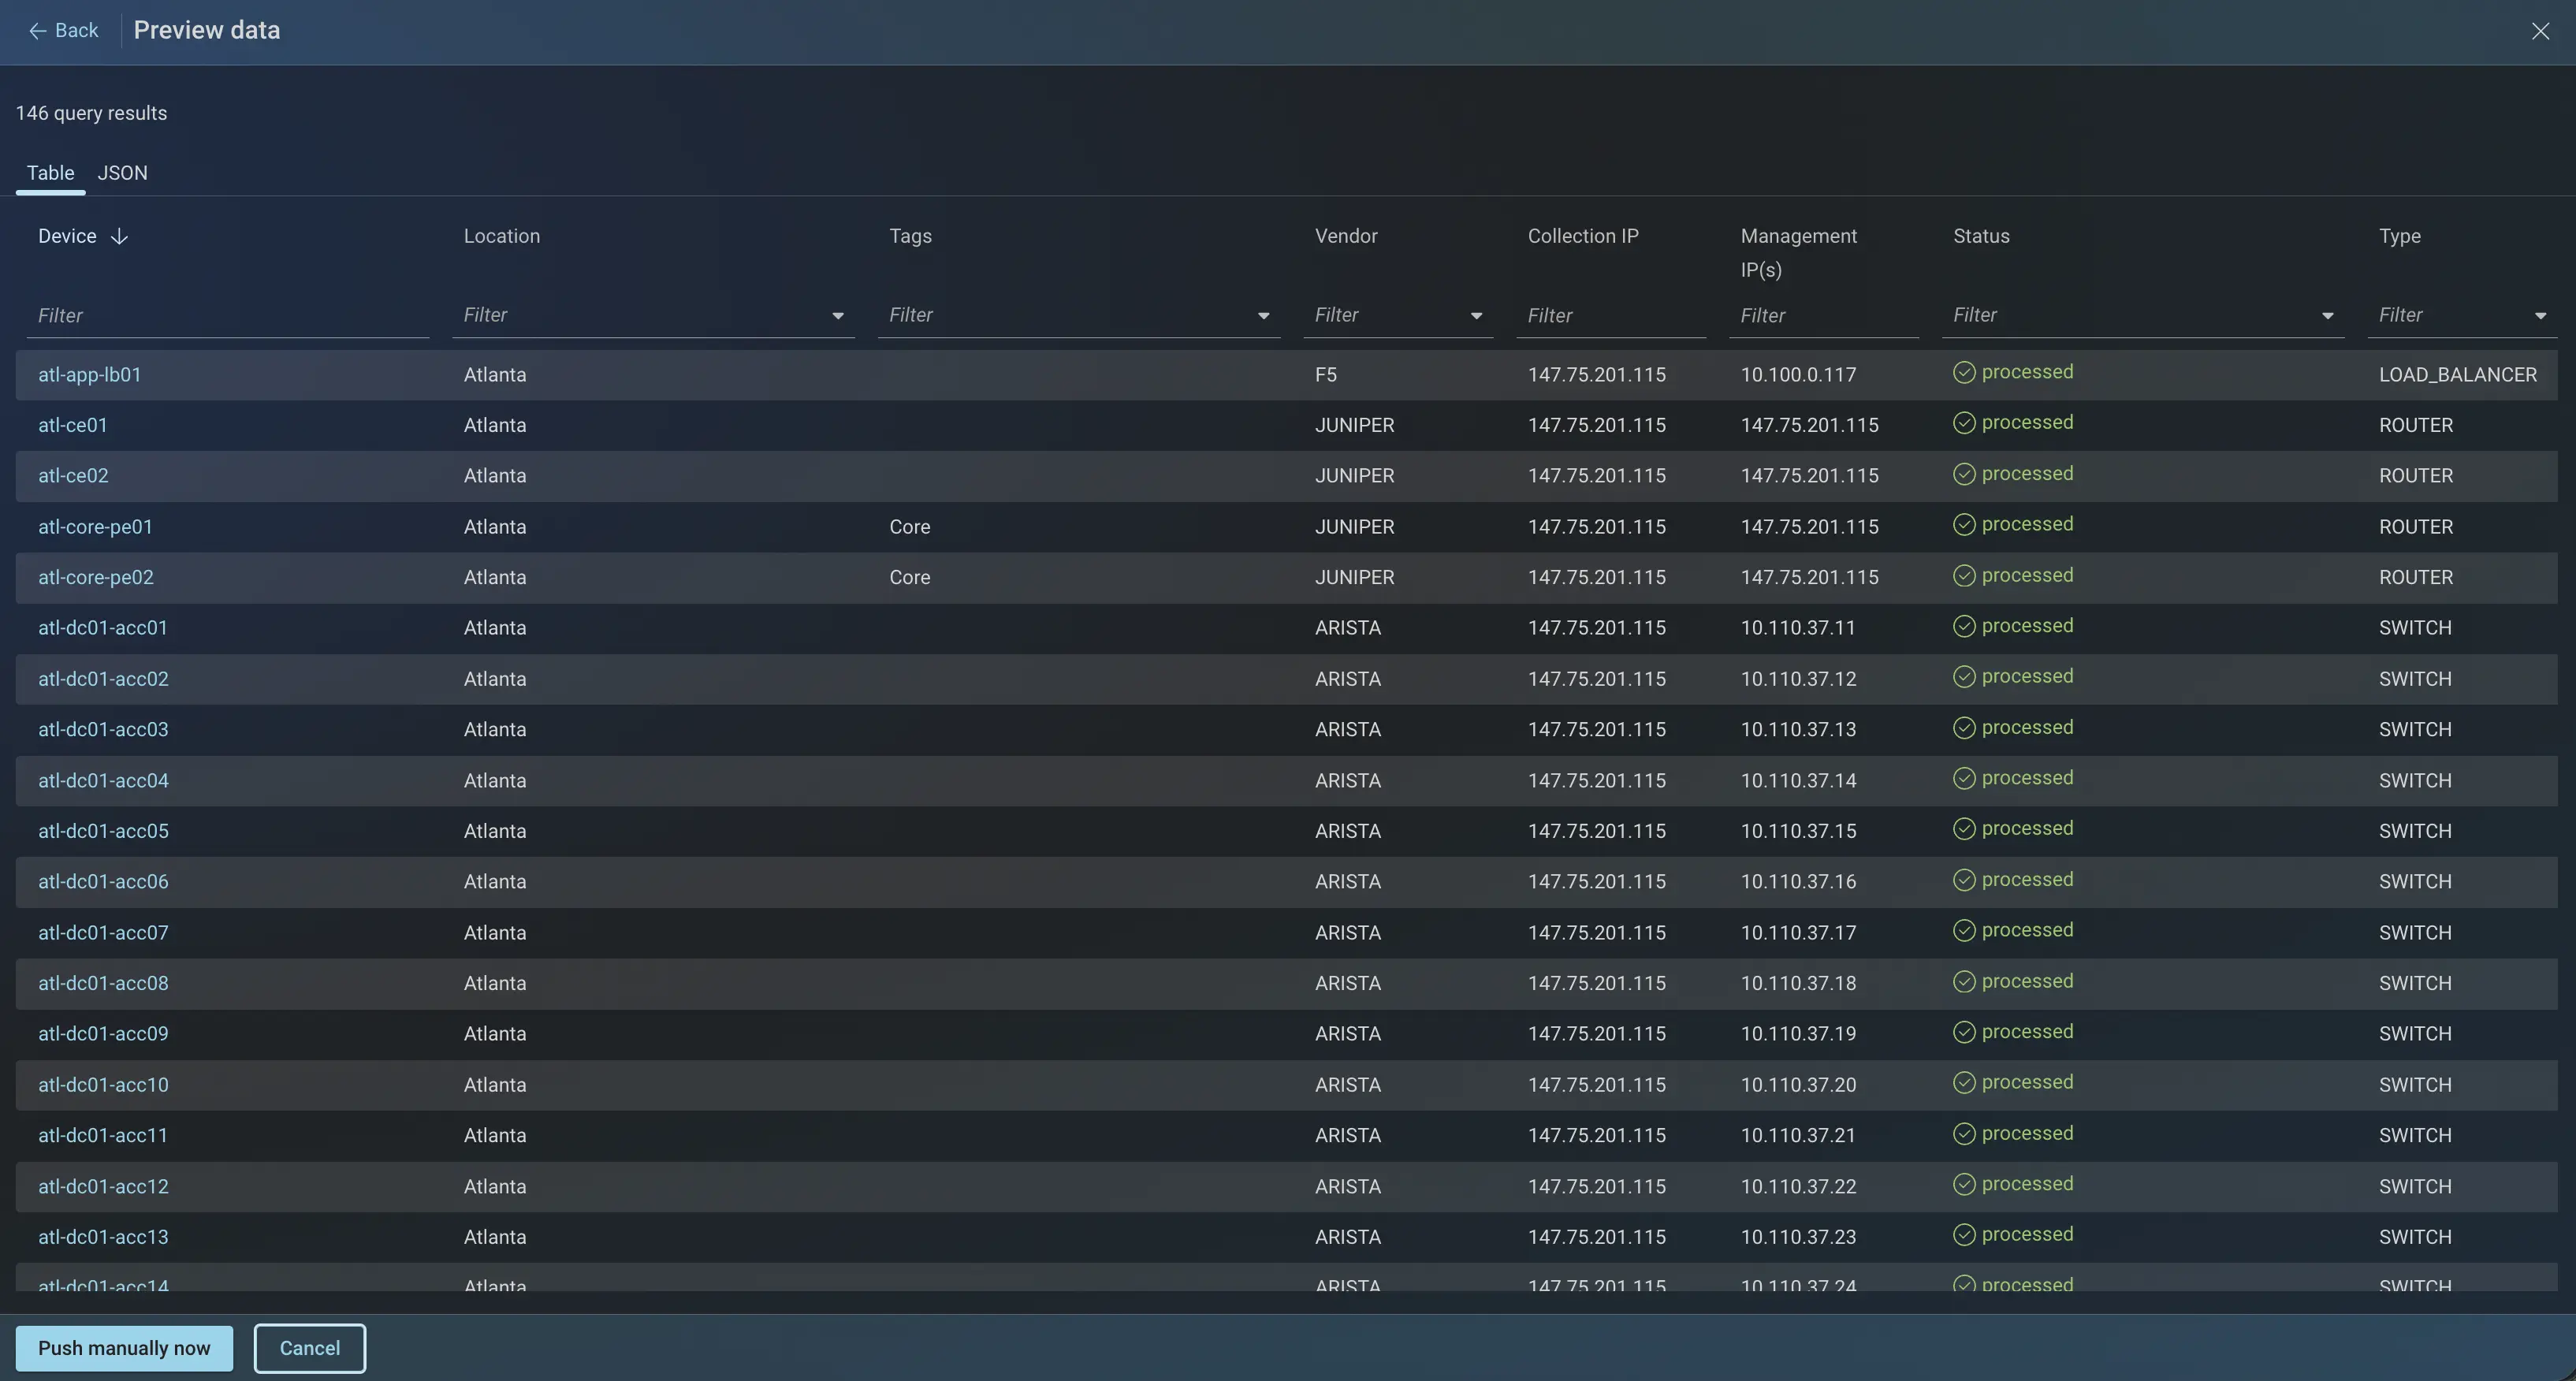
Before you push, you can preview the exact data that will be sent to Splunk. Click Review and push data to open the Preview data panel. You can see the data in Table and JSON formats in this panel. For an NQE Query profile with many results, click Load more at the bottom of the table to page through the data.
Push Data
From the profile, use Review and push data to open the Preview data panel which gives you an option to push on demand. At the bottom of the Preview data panel click Push manually now. A confirmation dialog opens before Forward sends the data to Splunk.
Forward creates one Splunk event per result. For example, five check results create five events.
A single push sends at most the first 100,000 events. If a profile produces more results than that, Forward warns you in the preview and the confirmation window, and sends only the first 100,000 events.
Automatic push runs on its own after each snapshot is processed.
Once the data is pushed, you can search and visualize it in Splunk. The event fields are searchable, so you can build charts, such as failures over time for a verification.
View Push Logs
Each profile keeps a history of its pushes. Select the View logs option for a profile to open that profile's push logs. For each push, the log shows:
- Timestamp: when the push was executed.
- Push type: Manual or After Snapshot processing (automatic).
- Status: whether the push succeeded or failed.

For an NQE Query profile, use Download .csv to download the push records in the logs table.
To inspect a push, select View pushed data to open the Data pushed at panel, which shows the exact payload. In this panel, use Download .json to download the pushed data.
Push logs are retained for the past 6 months.
Enable or Disable a Profile
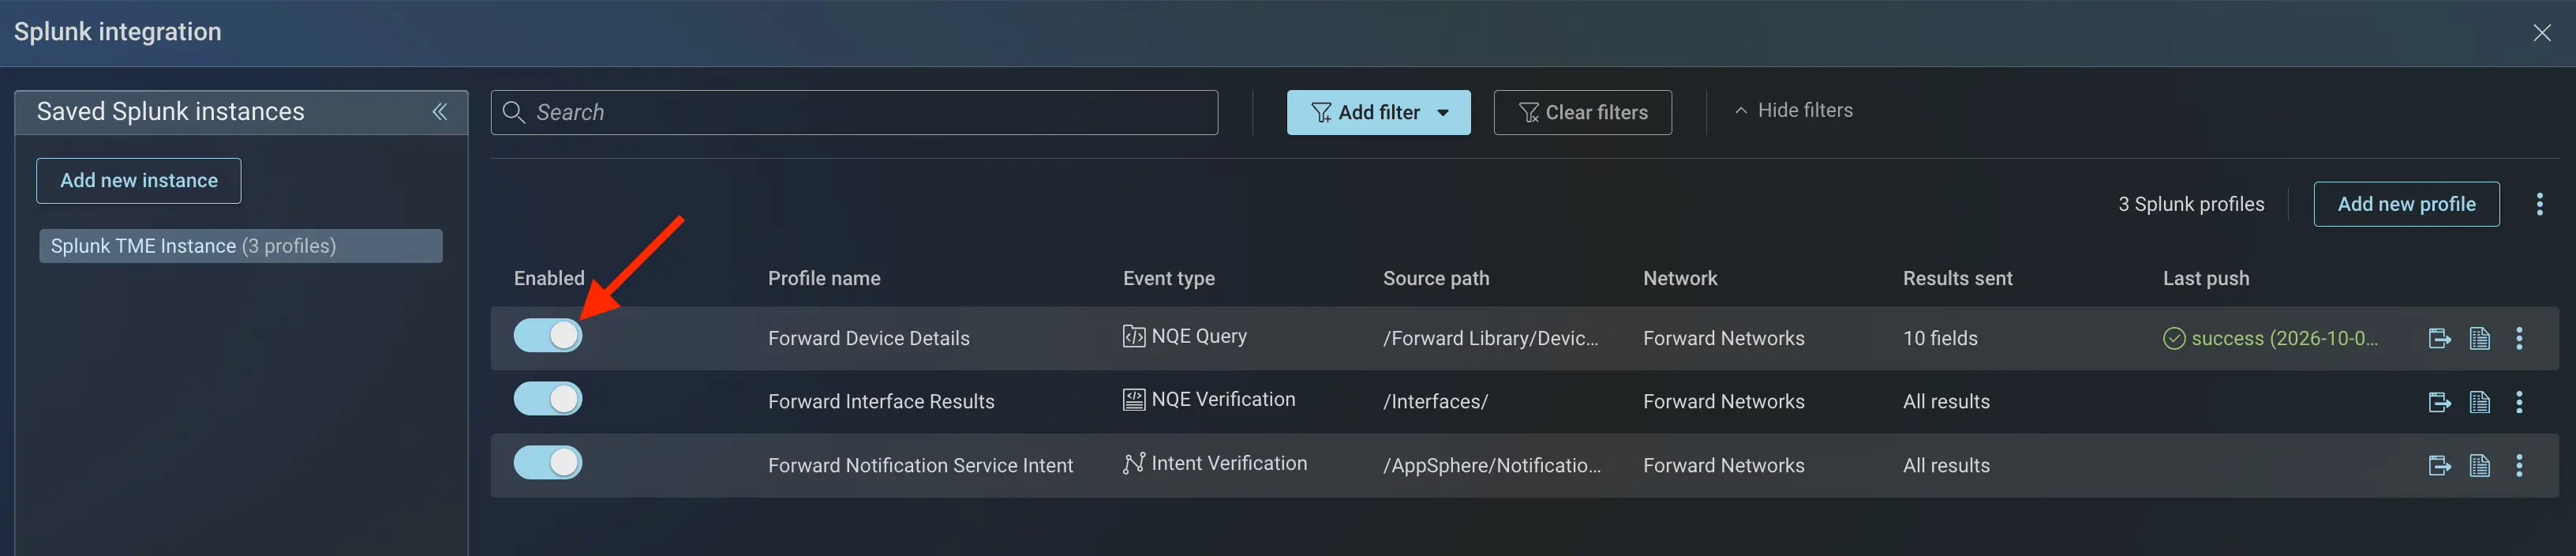
Use the Enabled toggle on a profile to control automatic data pushes. When a profile is disabled, Forward does not push its data automatically after a snapshot is processed. Manual push still works, so you can push the profile's data on demand with Review and push data. Disabling a profile keeps its configuration, so you can re-enable it later to resume automatic pushes.
Manage Instances
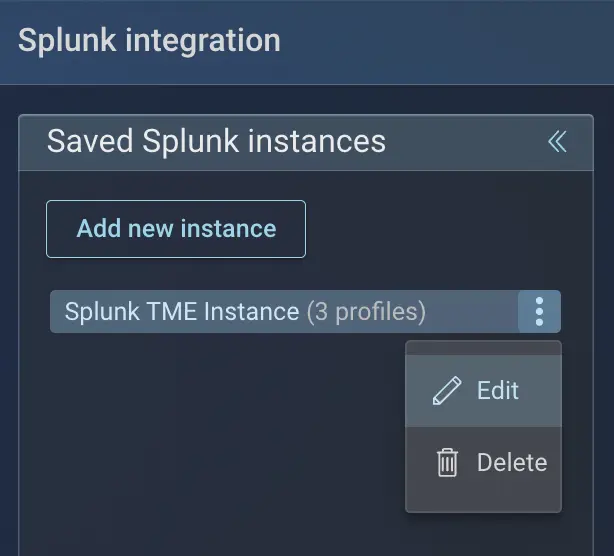
To change an instance, use the 3-dot menu with options to Edit and Delete that instance. Editing allows you to update instance details, such as the name, HEC URL, token, or target index. Deleting an instance removes it along with its profiles and stops all its pushes.
Manage Splunk Integration
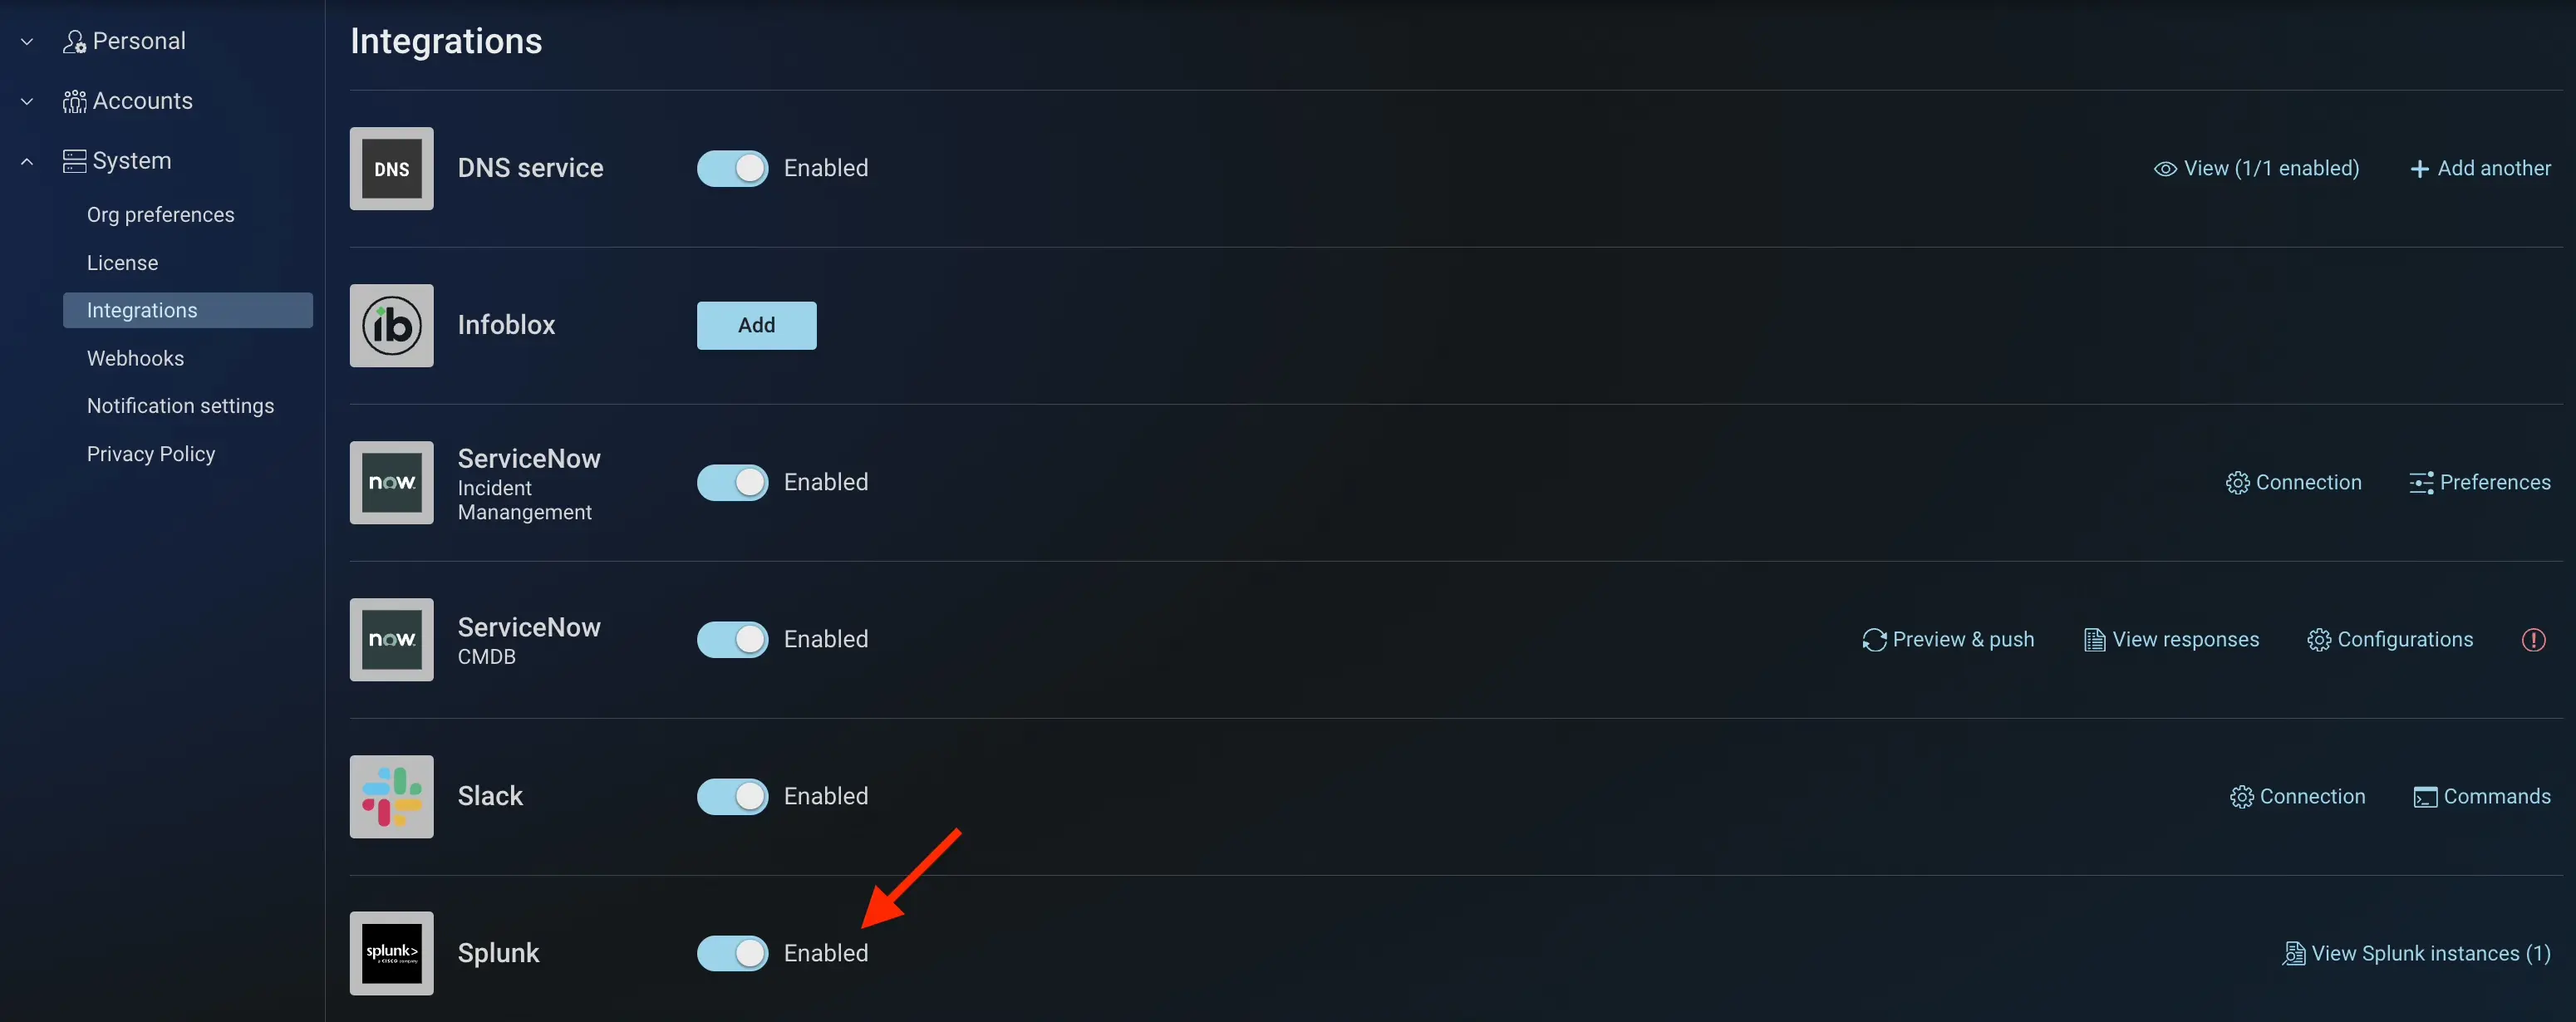
Use the enable or disable toggle in the Splunk section of the Integrations page to control the whole integration. Disabling the integration stops all automatic and manual pushes for every profile across all instances. Re-enable it to resume.
Disabling the integration does not delete anything. Your Splunk instances, profiles, logs, and usage history are retained, and your configuration remains unchanged when you re-enable the integration.