System
The System Overview page provides Forward cluster's health status, backend jobs information, audit logs, NQE Execution status and the Engagement tabs.
Forward Cluster Status
The Status view provides a consolidated overview of your Forward cluster's health, configuration, and resource utilization.
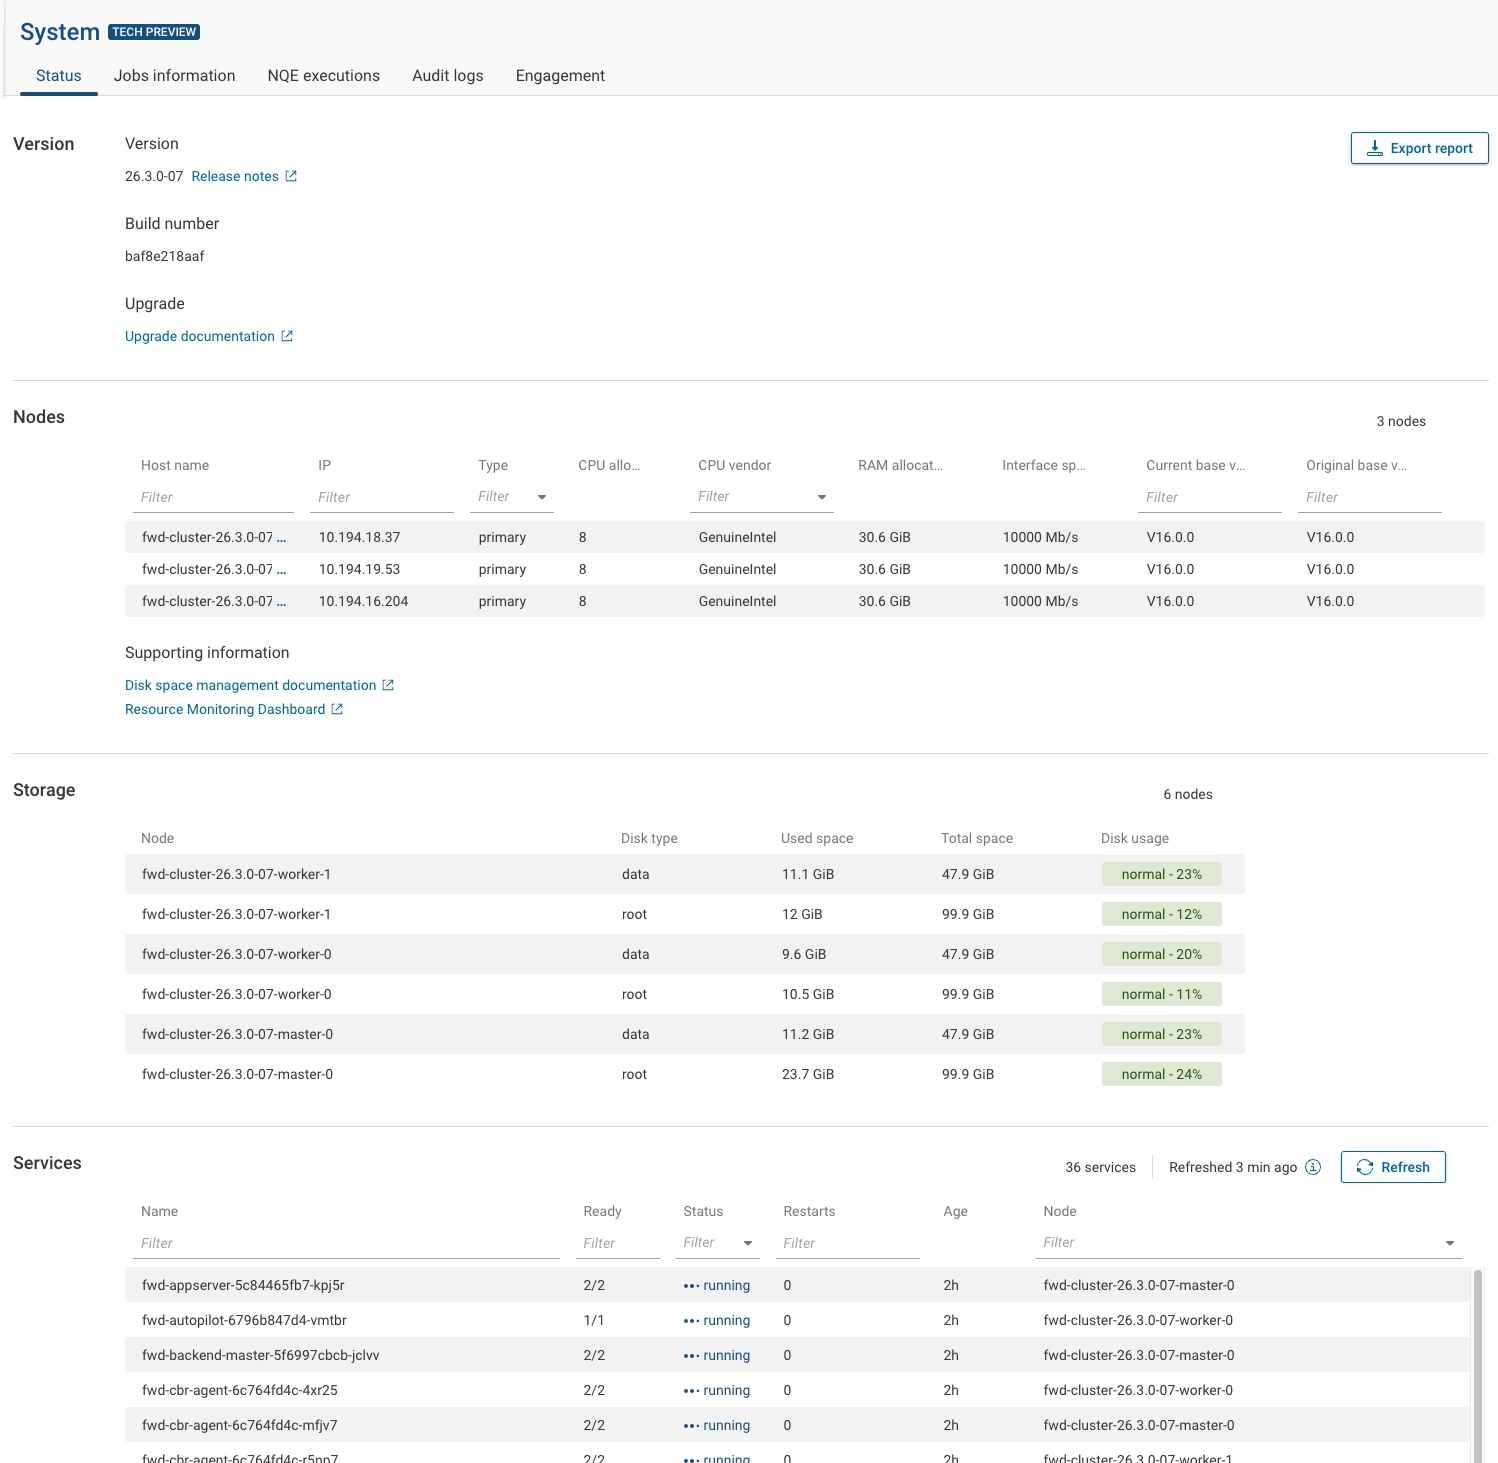
It helps administrators to quickly verify the cluster status, node details, and the state of platform services.
Access this view from System → Status in the left navigation pane.
The page displays real-time information about cluster nodes, storage usage, and running services in the Forward platform.
You can also export the current system state for reporting or troubleshooting.
Version Information
At the top of the view, the Version section displays:
- Version – The currently installed Forward release version.
- Build number – Internal build identifier for the deployed release.
- Upgrade – Links to upgrade documentation and release notes.
Node Details
The Nodes section lists all nodes in the cluster along with detailed hardware and configuration information, including:
- Host name and IP address
- Node type (e.g., primary, worker)
- CPU vendor and number of cores
- Configured RAM
- Interface speed
- Current version and original base version
This section provides an at-a-glance summary of cluster composition and node specifications.
Storage Details
The Storage section displays data and root partition usage for each node.
For each disk type, the following details are shown:
- Used space and total capacity
- Usage percentage
- Disk usage status (e.g., normal, warning, critical)
The detailed usage metrics allow administrators to identify potential capacity issues more easily.
Service Status
The Services section lists all active platform services running within the Forward namespace. It includes:
- Service name
- Readiness and status
- Restart count
- Uptime (age)
- Associated node
Each service shows a running status when healthy.
Services that are restarting, crash-looping, or otherwise unhealthy will appear here for visibility and troubleshooting.
Click Refresh to update the list with the latest runtime state.
Exporting Status Reports
Select Export report in the upper-right corner to download a snapshot of the current cluster state.
This report can be shared with Forward Support or used for internal auditing and record-keeping.
Jobs Information
The Jobs Information view provides Forward Org Admins with enhanced visibility into backend active and completed jobs, enabling them to quickly identify jobs that may affect overall system performance.
This view includes system backend jobs only. It does not include collector jobs.
Access this page from System → Jobs Information in the left navigation pane.
Both views can be updated by clicking on refresh. The system provides an indication of how long ago the view was refreshed.
Active Jobs
The Active view provides the list of jobs currently running in the system.
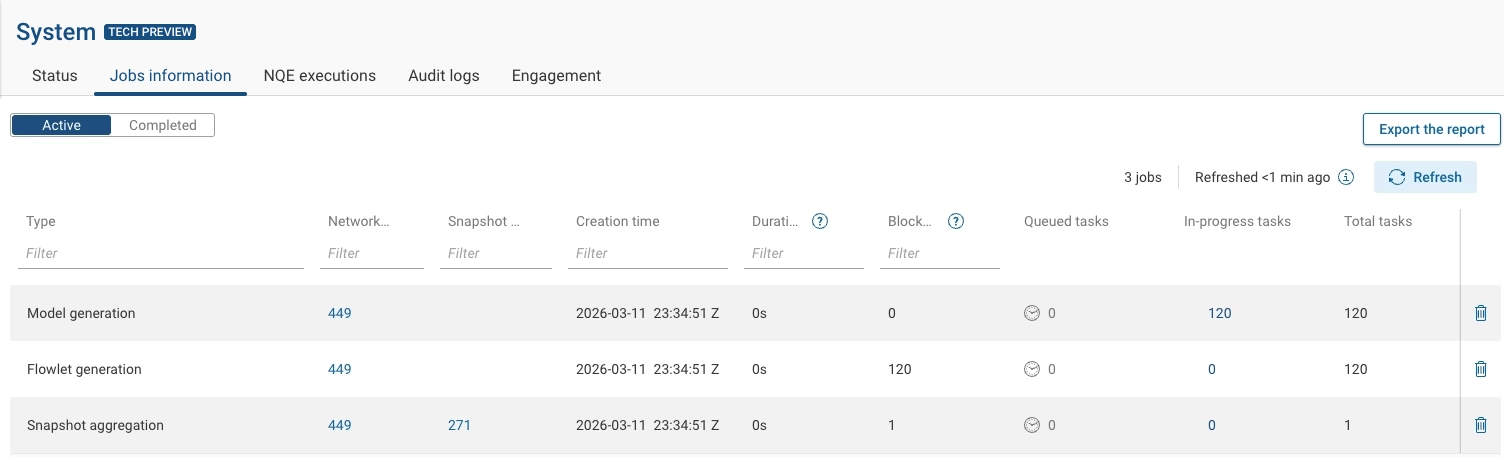
Data points available in this view for each job include:
- Type: Name of the job (e.g., NQE Query Computation, Internet Exposure Analysis, Reachability computation).
- Network ID and Snapshot ID: IDs associated with the job. Note that some job types may not have a Snapshot ID. Diff-related jobs indicate the Snapshot ID of the base snapshot.
- Creation Time: Timestamp when the job was created.
- Duration: Elapsed time from the earliest creation time to the present including time spent waiting for dependencies, waiting in the queue and time since the job started executing.
- Blocked, Queued, In-progress, and Total tasks: Number of tasks in different stages; blocked on dependencies, waiting in queue after all dependencies have executed, currently being executed in the backend, and the total number of tasks associated with the job. A single job in the table represents a group of multiple underlying tasks, for example an NQE Query Computation job can include many individual NQE query tasks. Tasks of the same type for the same snapshot or network are grouped to avoid displaying hundreds or thousands of individual entries.
- Cancel: Clicking on the bin icon cancels all the jobs in the row.
Completed Jobs
The Completed view displays a list of all jobs that have finished execution.
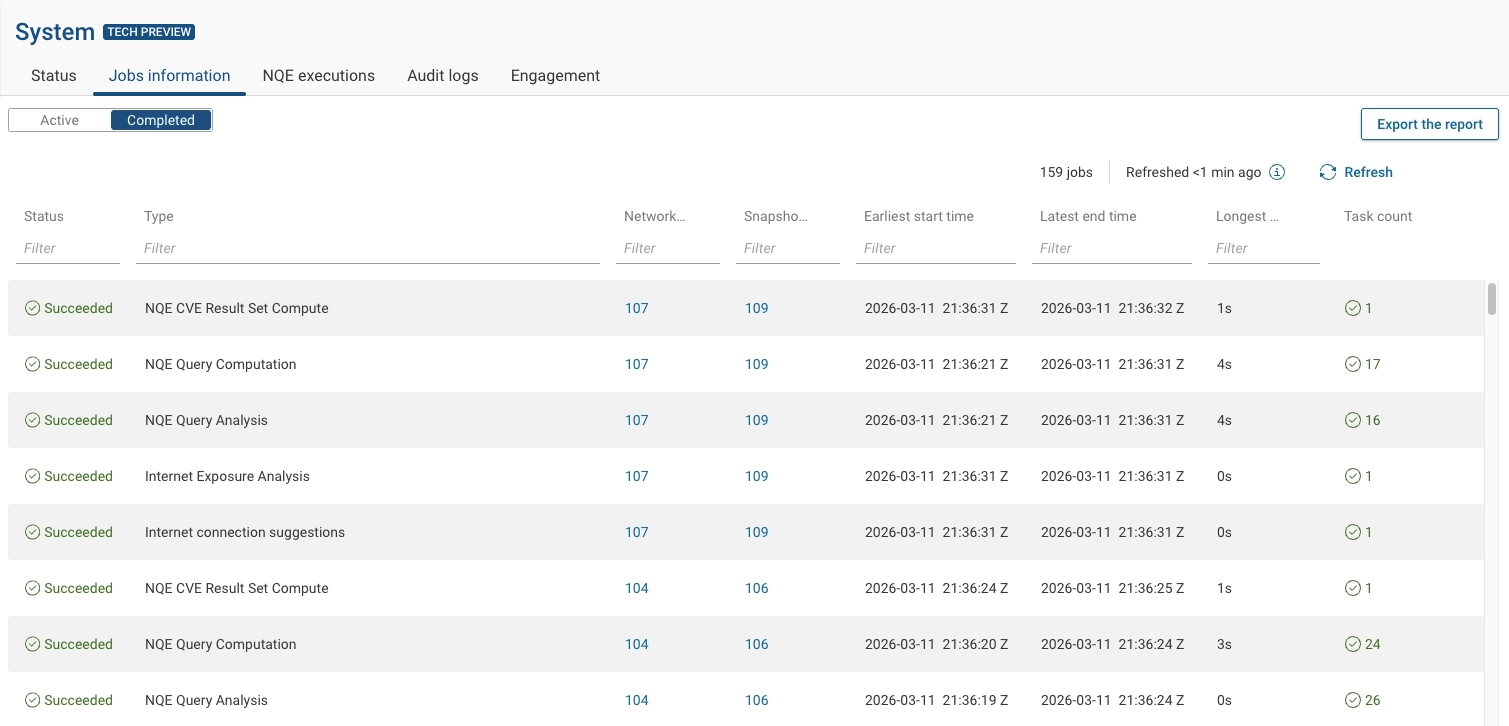
Data points available in this view for each job include:
- Status: Final state of the job, such as Succeeded, Canceled, or failed.
- Type: Name of the job (e.g., NQE Query Computation, Internet Exposure Analysis, Reachability computation).
- Network ID and Snapshot ID: IDs associated with the job. Note that some job types may not have a Snapshot ID. Diff-related jobs indicate the Snapshot ID of the base snapshot.
- Earliest start time and Latest end time: Timestamp of the start time of the first task, and end time of the last task.
- Longest Duration: Duration of the longest-running task, including time spent waiting for dependencies to complete, time spent waiting in queue and time for actual execution.
- Task count: Total number of tasks associated with the job, color-coded based on the job Status.
NQE Executions
Overview
The NQE Executions view provides Forward Org Admins with enhanced visibility into slow-running NQE queries, enabling them to quickly identify and diagnose queries that may affect overall system performance. The view displays the slowest query executions within a selected time range.
NQE queries that are still running are not included in this view. For information on currently running NQE jobs, see the Active Jobs Information view.
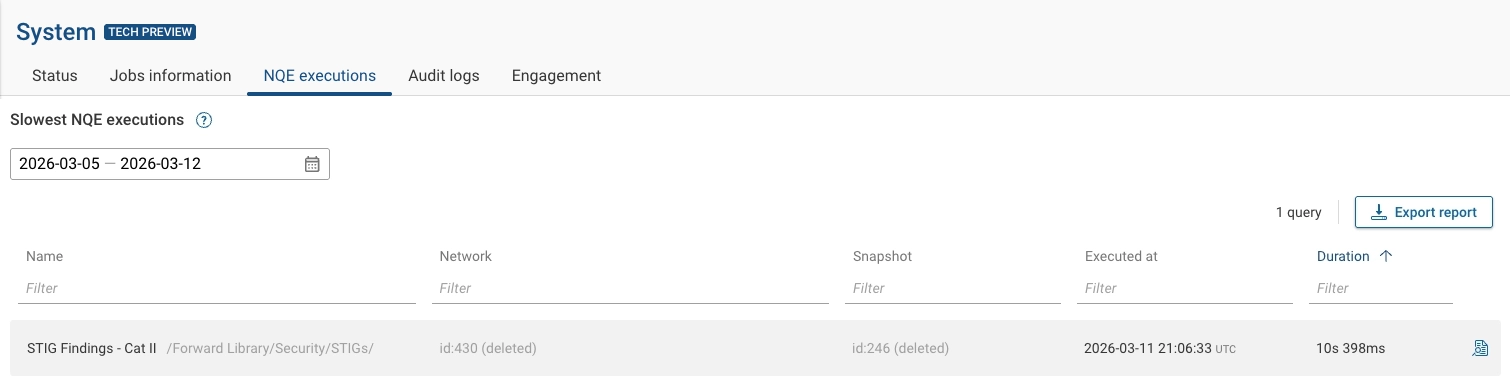
Access this page from System → NQE Executions in the left navigation pane.
Report Details
The report includes:
- The top 100 slowest executions that took more than 10 seconds to run, ordered from slowest to fastest.
- The time shown represents the actual query execution time; time spent waiting in the queue is not included.
- One row per unique query, even if the query was executed across multiple networks or snapshots. A query may appear more than once if it was modified during the selected time range. Draft queries are included as well.
- The row reflects the slowest execution of that query within the selected period.
Query execution times are retained for 30 days, so the Start date can go back up to 30 days.
For each listed query, you can:
- View the full query contents.
- Open the query in the NQE Library, if the query is saved there.
- Export the data for analysis or for sharing with Forward Customer Success teams.
Exporting NQE Executions Reports
To export a report containing the slowest NQE queries, select Export report in the upper-right corner.
You can choose between two options: Local download or Send to Forward.

The exported report is provided as a ZIP file containing:
- Metrics: An Excel file with all slow queries, regardless of any UI filters. Each row includes additional metadata to help diagnose potential issues.
- Sources: A folder containing the full source text for each query included in the report.
Query results or any other customer data are not included in the report.
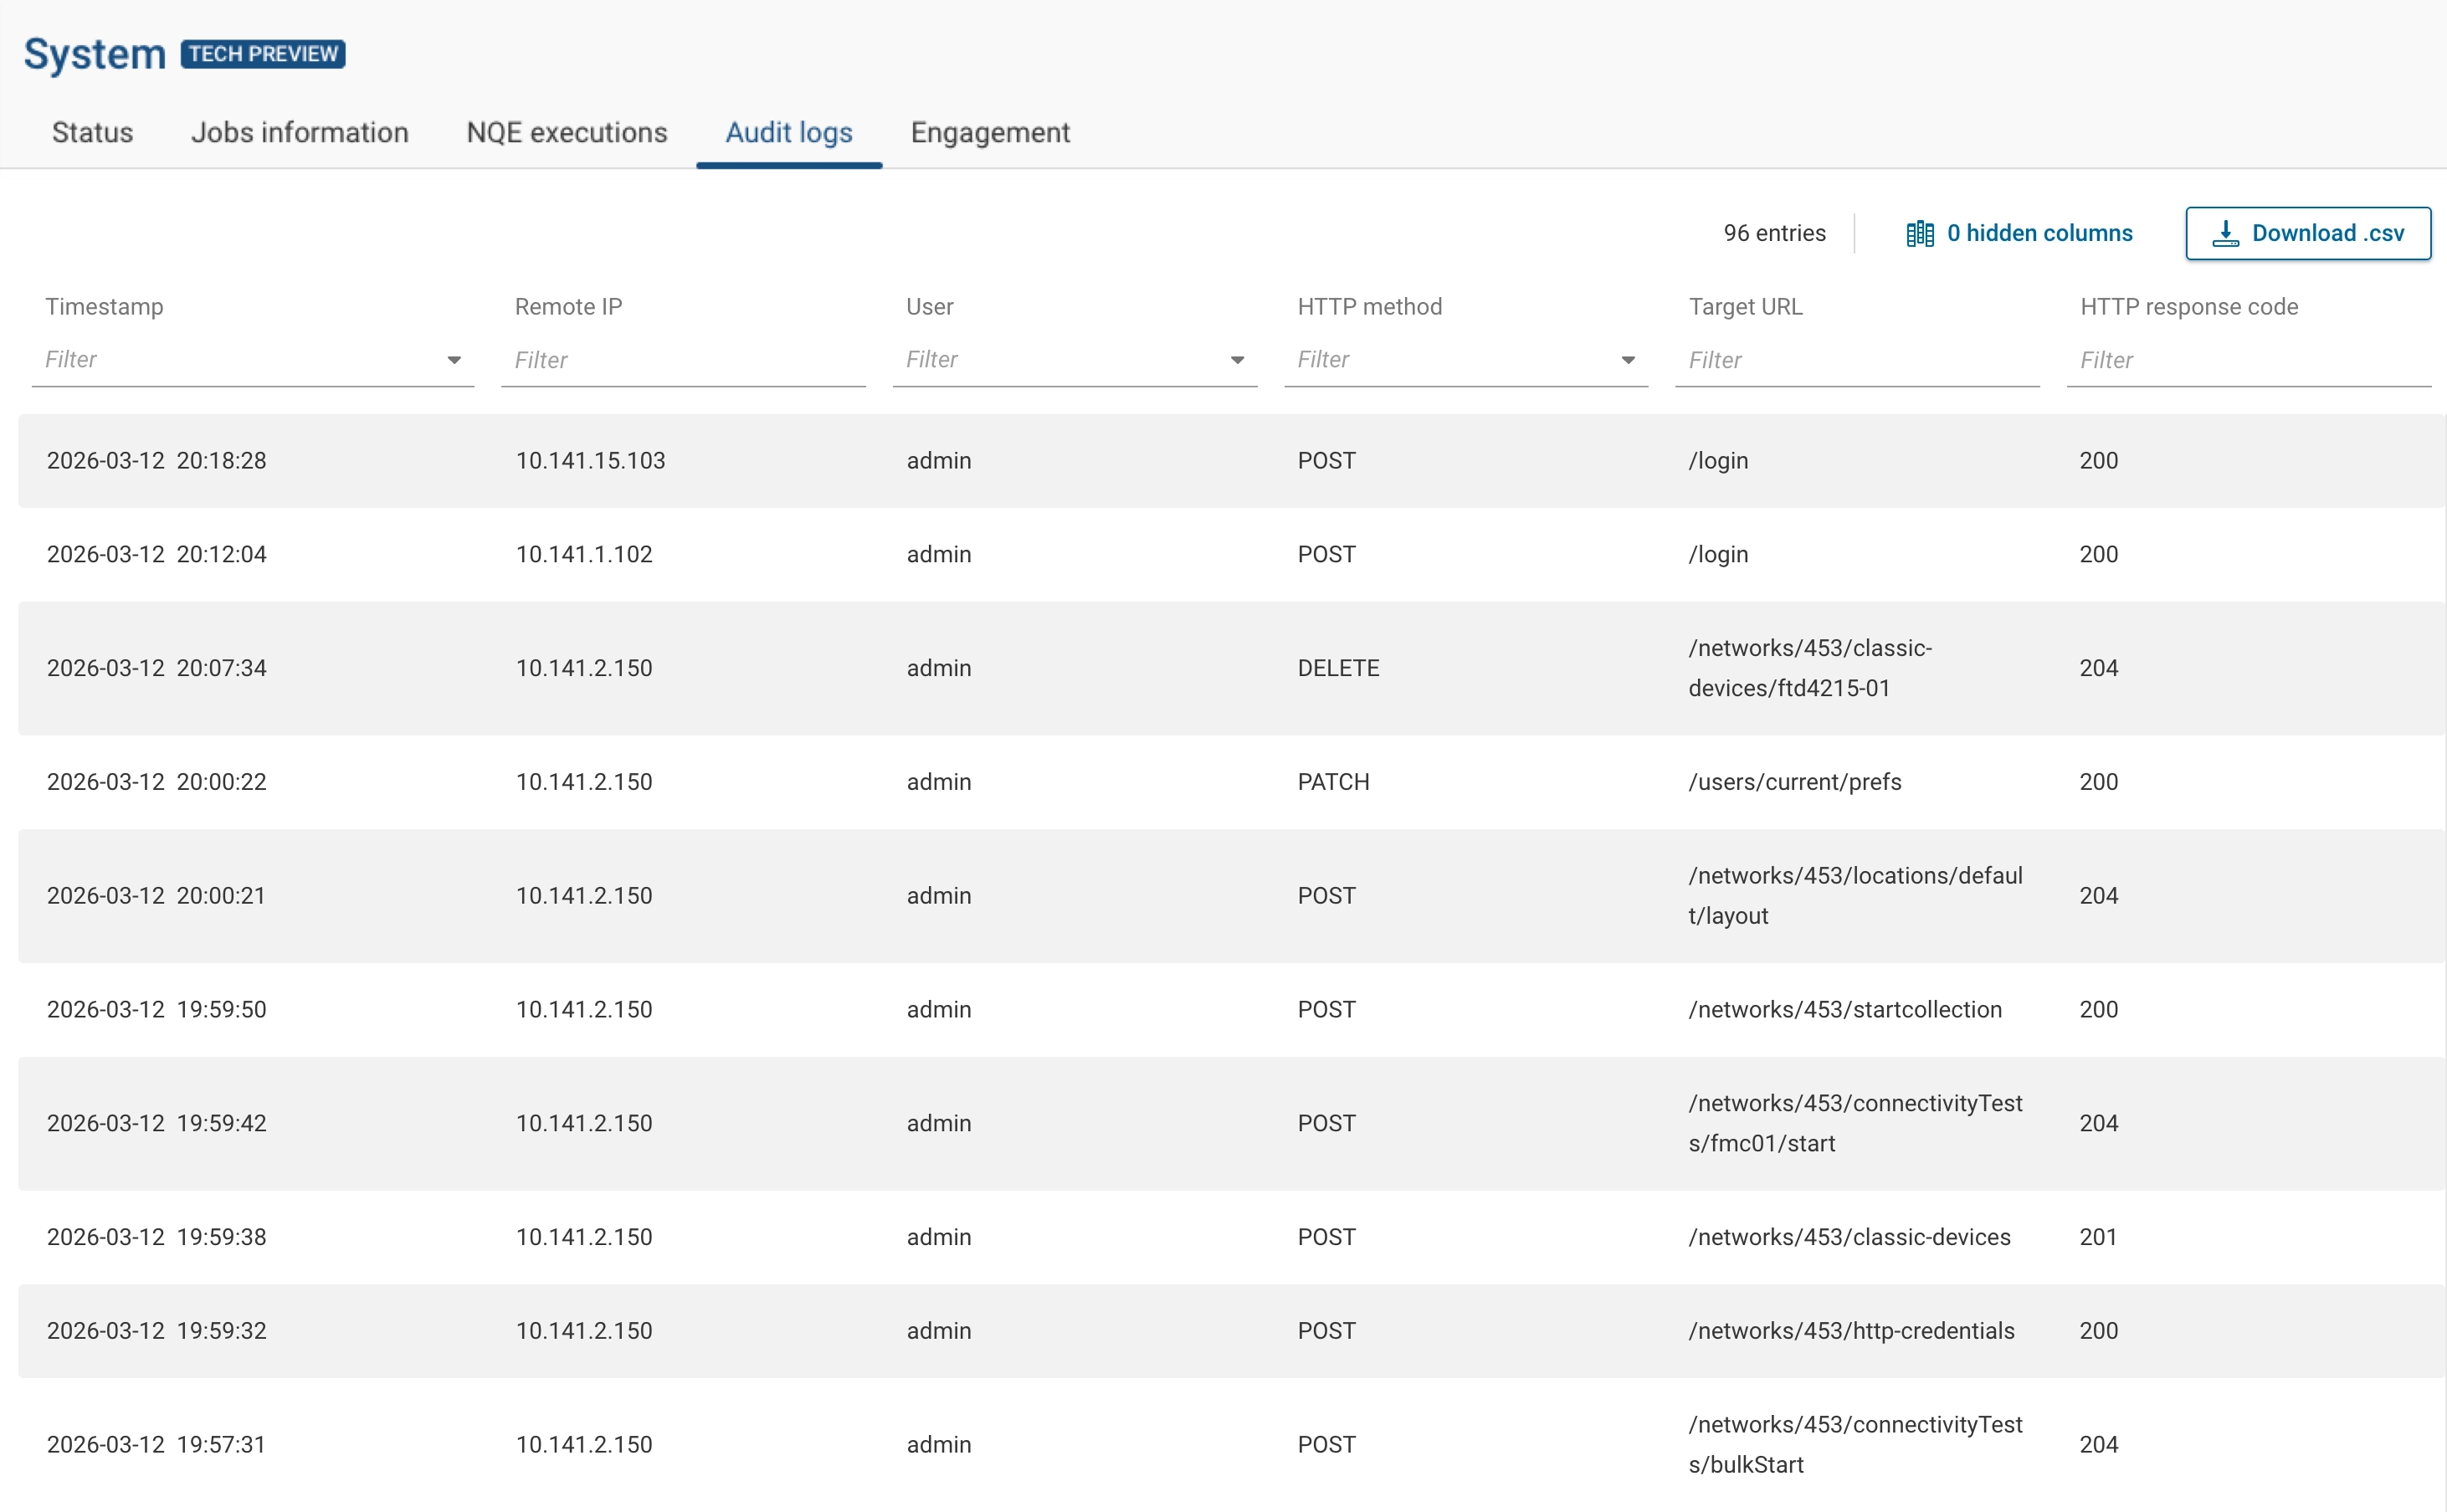
Audit Logs
The Audit logs page provides a detailed record of all mutable operations performed on the platform, enabling Org Admins to monitor and review changes made by users across the organization.
Access this page from System → Audit logs.
What Gets Logged
The audit log captures all operations that change the state of user-created objects in the platform. This includes API calls using the following HTTP methods:
- POST (create operations)
- PUT (replace operations)
- PATCH (update operations)
- DELETE (delete operations)
GET requests are not logged, as they do not mutate state.
Additionally, the following events are logged:
- User login and logout events
- Authentication failures (logged in the backend for security purposes, but not displayed in the UI)
The following operations are explicitly not logged, even when using POST:
- Running NQE queries
- Testing connectivity
These are excluded because they do not modify platform state and would generate excessive noise in the log.
Log Entry Details
Each audit log entry includes the following columns:
| Column | Description |
|---|---|
| Timestamp | When the operation occurred. Displayed in the user's configured local time zone. Hovering over the timestamp shows both the local time zone and UTC. |
| Remote IP | The IP address from which the request originated. |
| User | The user who performed the operation. When a Forward admin impersonates a user and performs a mutation, the audit log records the action as performed on behalf of the impersonated user. The identity of the Forward admin performing the impersonation is not exposed to Org Admins. |
| HTTP Method | The HTTP method used (POST, PUT, PATCH, DELETE). |
| Target URL | The API endpoint that was called, including query parameters when applicable. This may include both published and internal (hidden) API endpoints. |
| HTTP Response Code | The HTTP response code returned (e.g., 200, 401, 403). |
Time Zone Display
Timestamps are displayed in the user's configured local time zone (set in user preferences). When hovering over a timestamp:
- If the user's time zone differs from UTC, both the local time and UTC are shown.
- If the user is on UTC, only UTC is displayed.
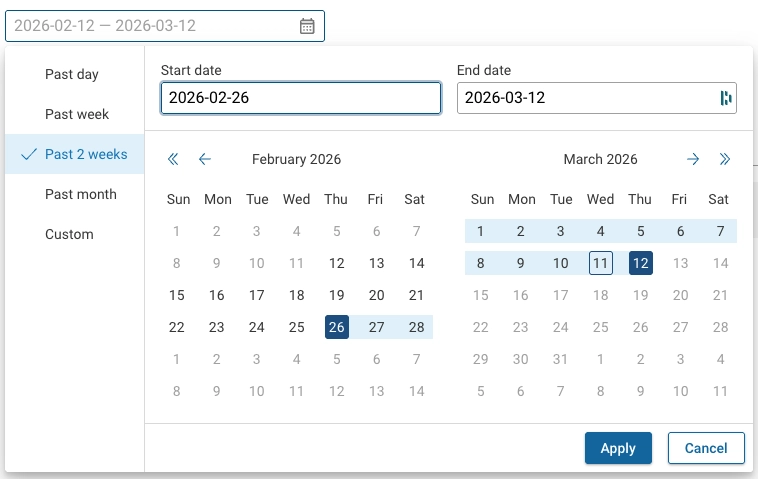
Filtering and Search
The audit log supports server-side filtering to handle large volumes of records:
- Time range: Filter by predefined ranges (e.g., past week, past year) or custom date ranges.
- Remote IP: Performs a textual search against the IP address field. Users can enter a complete address or a prefix to match specific subnets or IP patterns.
- User: Select from a drop-down of users in the organization.
- HTTP Method: Select from a drop-down of known methods.
- Target URL: Free-text prefix search (starts-with matching), since URL values can vary widely.
- Response Code: Free-text search.
Pagination
Audit log entries are loaded in pages of 1,000 entries by default. Click Load More to fetch the next page of results. The total number of matching entries is displayed above the table.
Security
- Sensitive data such as tokens are automatically redacted from the audit log entries, even if they appear in query parameters.
- Query parameters are included in the Target URL to help distinguish actions on APIs that use parameters to
differentiate operations (e.g.,
?action=resolve).
Access Control
The Audit Log page is accessible to Org Admins and support users via impersonating an Org Admin.
Exporting Audit Log Data
To export audit log data:
- Select Download.csv.
- If a time range filter is already applied, the export honors that selection.
- If no time range is selected, specify the number of look-back days for the export.
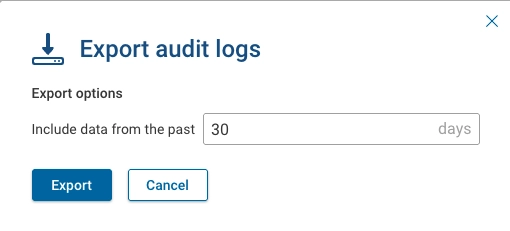
The exported data is downloaded as a file for offline analysis or reporting.
Retention
Audit log retention is configurable per organization, ranging from 30 to 365 days. This setting is available in the Settings → System → Org preferences page.

Engagement
The Engagement view provides deeper visibility into how different user groups interact with the platform. It highlights variations in platform utilization by distinguishing between users or tools that rely heavily on API-based automation and integrations and those that primarily use the UI for hands-on analysis.
It provides a set of granular, segmented reports that analyze user activity across multiple dimensions, providing clear operational insights.
These reports deliver actionable metrics that help administrators and team leaders:
- Optimize resource allocation
- Identify training opportunities
- Improve platform adoption based on team workflows and skill sets.
The page can be viewed using Daily, Weekly, Monthly, or Custom trend within a selected time range (e.g., Past week, Past month, etc.).
UI
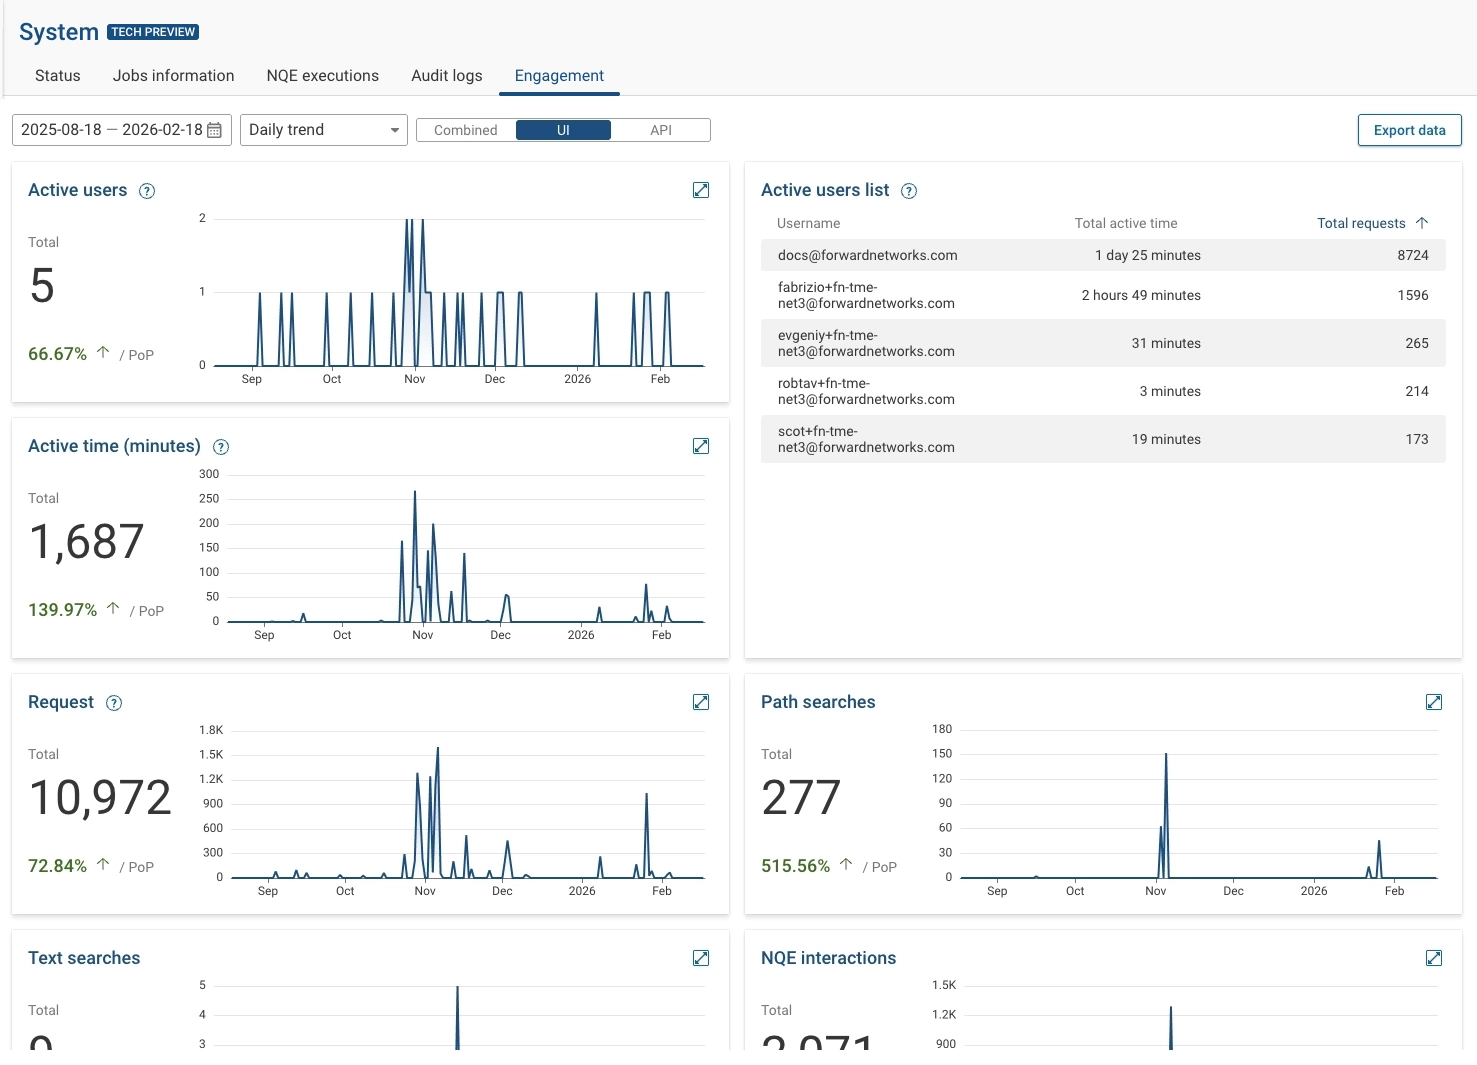
The UI view provides engaments insights over a set interval of time:
- Active users - Distinct users who made at least 2 UI-originated backend requests within any rolling 30-minute window.
- Active user list - List of all active users, and total time of activity.
- Active time (minutes) - Total activity time of all users on the platform.
- Request - Number of backend requests received from the UI. A single page view can trigger multiple backend requests. Browser asset loads are excluded. Retries are included once per unique request id. Includes success and error responses.
- Path searches - Total number of path searches issued.
- Text searches - Total number of text searches issued.
- NQE interactions- Total number of NQE interactions.
- NQE tutorial progress - List of the most active users for the NQE tutorial and the number of lessons each user has completed.
- NQE query executions - Total number of NQE queries executed.
- Collected file views - Total number of collected file views.
- Inventory views - Total number of inventory views.
- Diff views - Total number of diff views issued.
- Blast radius views - Total number of blast radius views.
- CVE views - Total number of CVE views.
- Exposure analysis views - Total number of exposure analysis views.
- Security matrix views - Total number of security matrix views.
- Dashboard views - Total number of dashboard views.
API
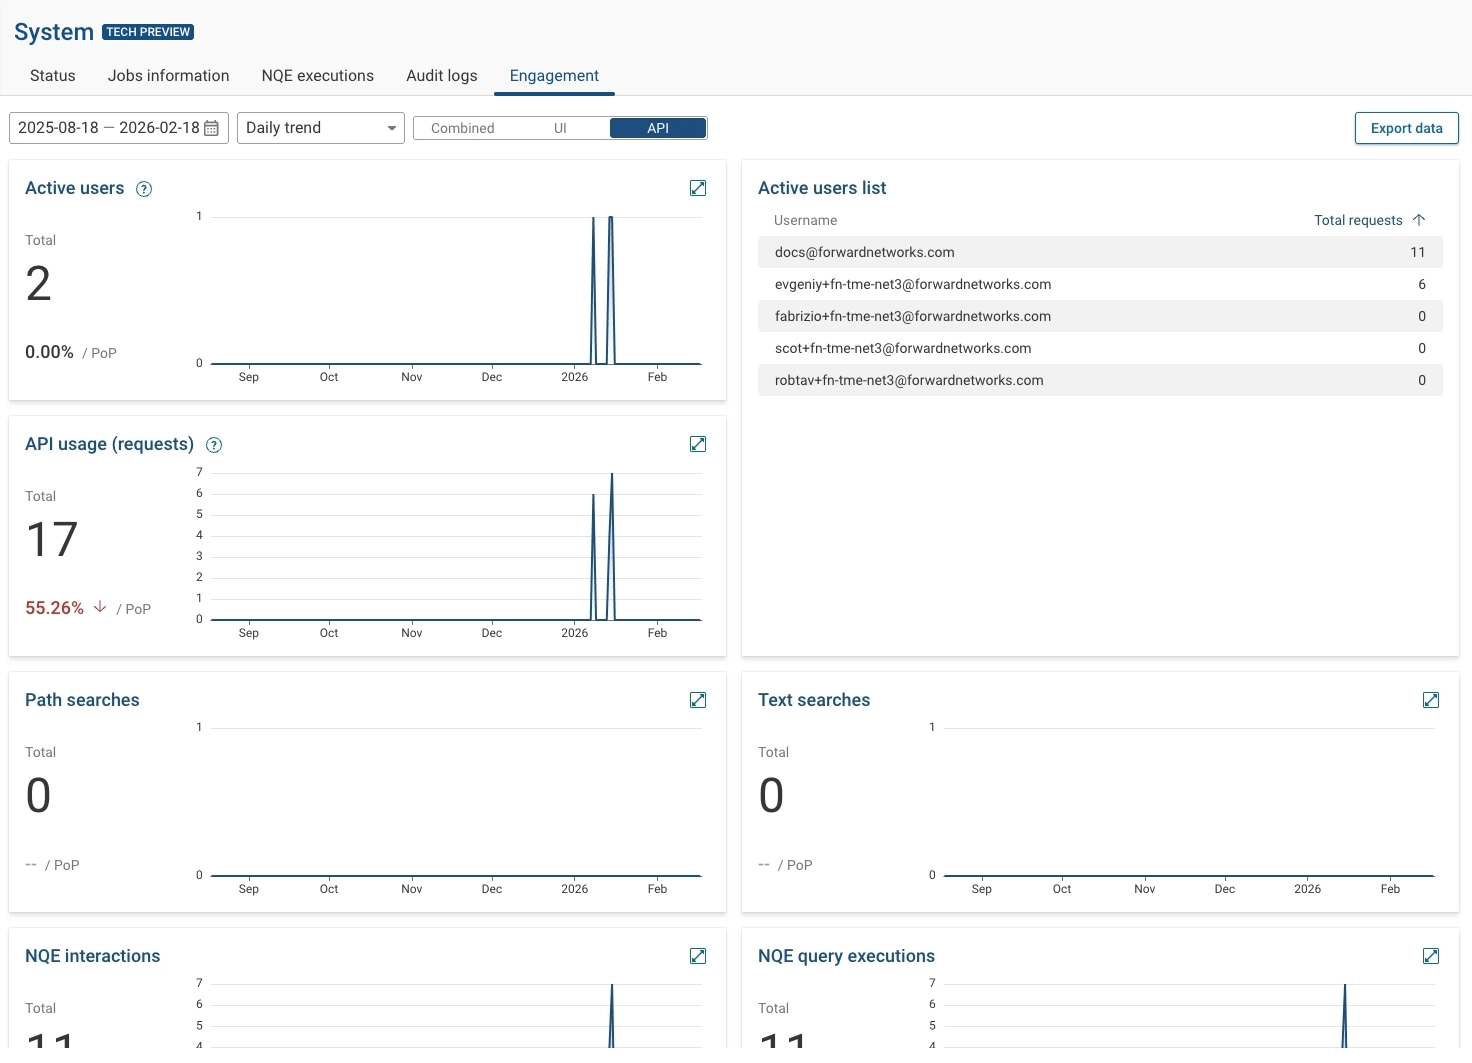
The API view provides engagement insights over a set interval of time:
- Active users - Distinct people who made at least 2 direct API requests within any rolling 30-minute window. Multiple tokens from the same owner are deduplicated.
- Active user list - Top users during the selected period.
- Requests = total backend requests attributed to the user.
- Active minutes = sum of session durations (if enabled). Users are deduplicated across UI and API.
- API usage (requests) - Number of backend requests received from the API during the selected time period. A single page view can trigger multiple backend requests. Browser asset loads are excluded. Retries are included once per unique request id. Includes also success and error responses.
- Path searches - Total number of path searches issued.
- Text searches - Total number of text searches issued.
- NQE interactions- Total number of NQE interactions.
- NQE tutorial progress - List of the most active users for the NQE tutorial and the number of lessons each user has completed.
- NQE query executions - Total number of NQE queries executed.
- Collected file requests - Total number of collected file requests.
- Inventory requests - Total number of inventory requests.
- Diff requests - Total number of diff requests issued.
- Blast radius requests - Total number of blast radius requests.
- CVE requests - Total number of CVE requests.
- Exposure analysis requests - Total number of exposure analysis requests.
- Security matrix requests - Total number of security matrix requests.
- Dashboard requests - Total number of dashboard requests.
Combined
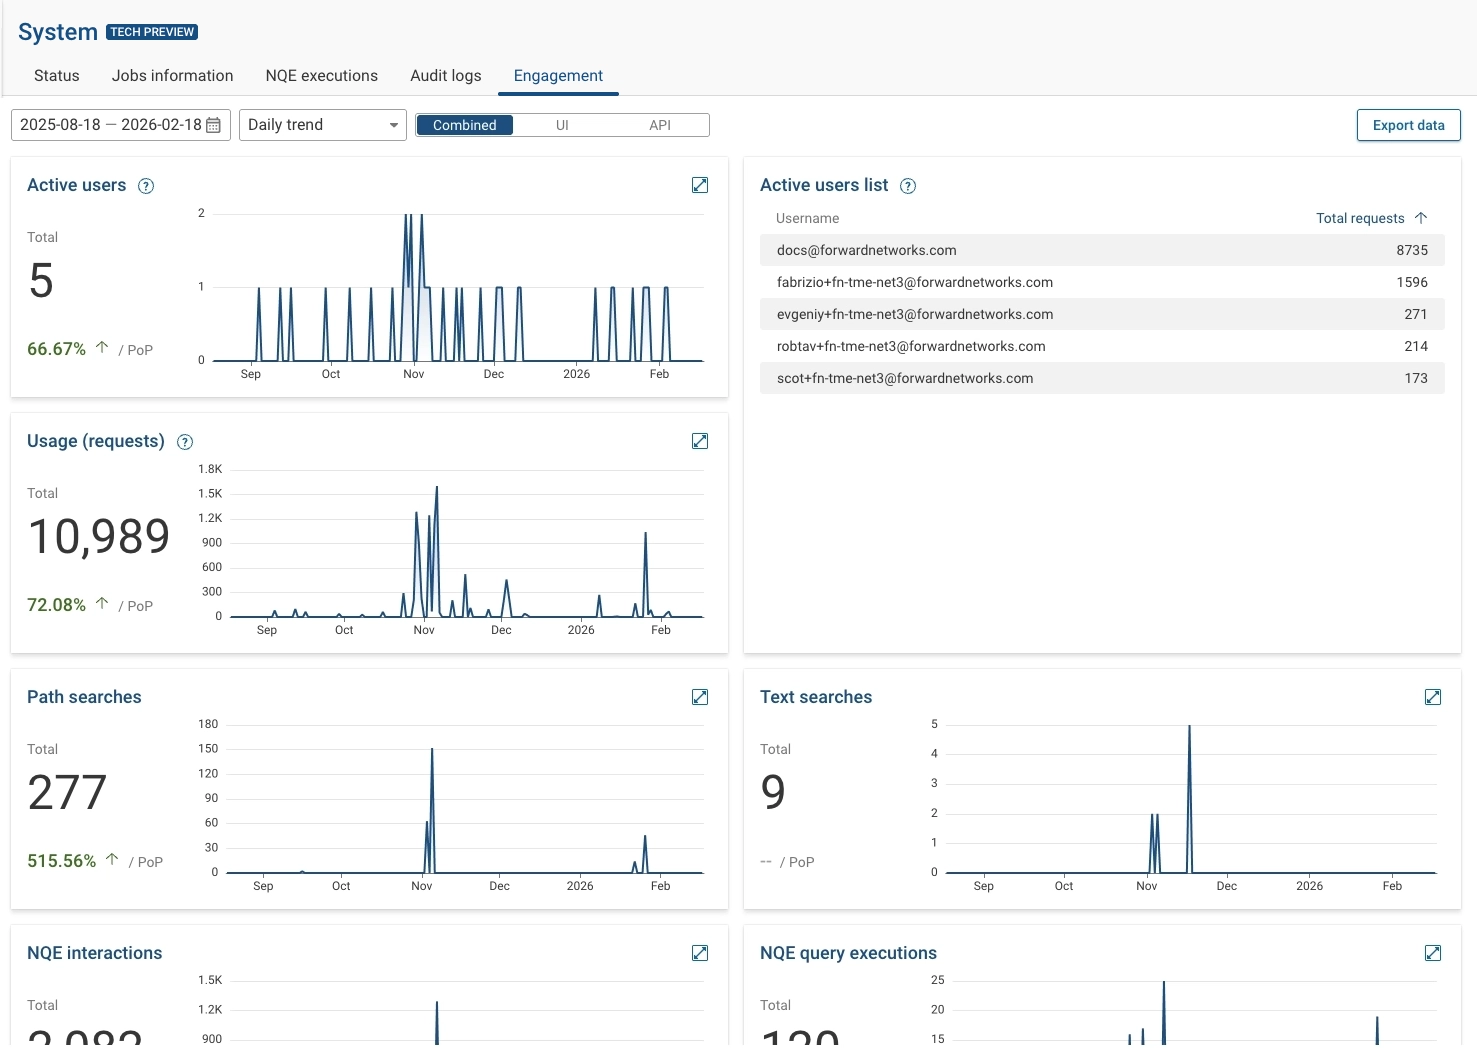
The Combined view provides engagement insights from UI and APIs over a set interval of time:
- Active users - Distinct people who made at least 2 backend requests within any rolling 30-minute window in the UI or API. API tokens are attributed to their owner; if a person is active in both channels within the same window, they count once.
- Active users list - Top users during the selected period. Requests shows each user's total requests across both channels for the selected period. Users are deduplicated across UI and API.
- Usage (requests) - Number of backend requests received from the UI or API. A single page view can trigger multiple backend requests. Browser asset loads are excluded. Retries are included once per unique request id. Includes also success and error responses.
- Path searches - Total number of path searches issued.
- Text searches - Total number of text searches issued.
- NQE interactions- Total number of NQE interactions.
- NQE tutorial progress - List of the most active users for the NQE tutorial and the number of lessons each user has completed.
- NQE query executions - Total number of NQE queries executed.
- Collected file requests - Total number of collected file requests.
- Inventory requests - Total number of inventory requests.
- Diff requests - Total number of diff requests issued.
- Blast radius requests - Total number of blast radius requests.
- CVE requests - Total number of CVE requests.
- Exposure analysis requests - Total number of exposure analysis requests.
- Security matrix requests - Total number of security matrix requests.
- Dashboard requests - Total number of dashboard requests.
Exporting Engagement Data
Organization Admins can export engagement statistics based on their specific needs, allowing them to retrieve the exact data required for reporting, analysis, or integration with external systems.
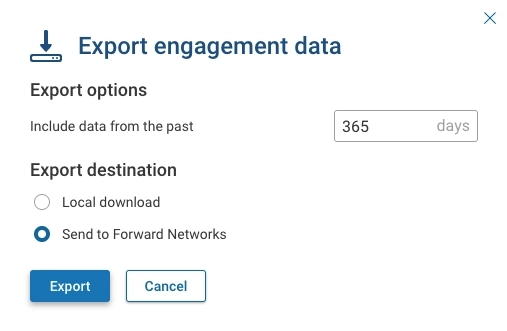
To export engagement data:
- Select Export data.
- Specify the desired date range by indicating the number of days to include in the export. Data is retained for up to 15 months.
- Select Export destination option:
- Local Download - Local download of a ZIP file containing several reports in CSV format
- Send it to Forward - Sends the report to the Forward support team
- Click Export.