Performance
Overview of the Performance Exercise
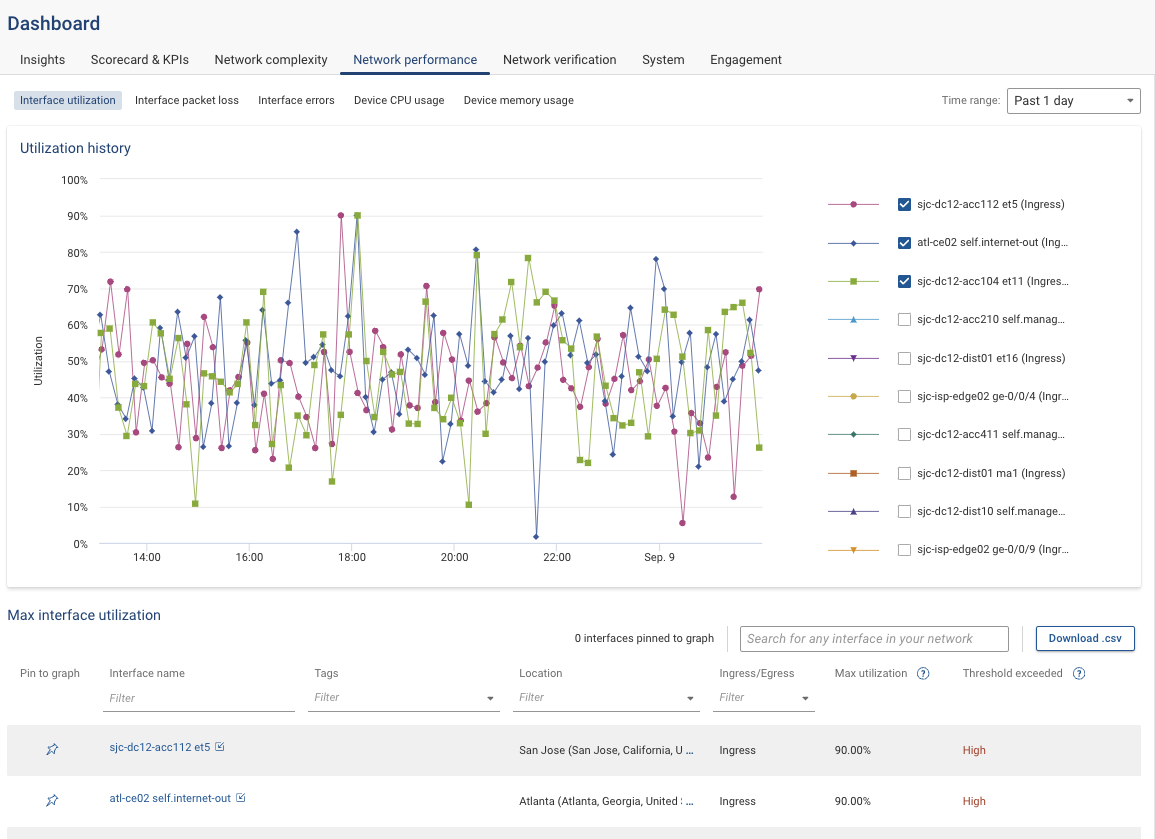
This exercise focuses on utilizing SNMP to collect and analyze network performance statistics, including device CPU, memory, and interface data. It aims to demonstrate how to enable SNMP collection and access performance data effectively.
Estimated Completion Time
10 minutes
Please inform your account team before starting this exercise so they can populate the data for you.
Exercises

Exercise 1: Accessing Device Performance Data
Objective: Learn how to access real-time performance data for a specific device.
- Search for Device: Enter the name of a device (e.g.,
atl-edge-fw01) in the search bar and press enter. - View Device Health: In the device card, find the dropdown labeled "Device health as of {time:Date}" and click it to view current health metrics.
Exercise 2: Analyzing Trend Data
Objective: Examine performance trends over specified periods.
- Select "See Charts": From the device card, choose "See charts" to review performance trends over the last day or 7-day period.
Exercise 3: Evaluating Interface Performance
Objective: Access and analyze performance data for specific interfaces.
- Navigate to Interfaces: Return to the device card, click on "Interfaces," and select an interface (e.g.,
gi0/0). - View Interface Health: Click the dropdown labeled "Interface Health" to see the latest metrics.
Exercise 4: Reviewing Trend Data for Interfaces
Objective: Explore performance trends for interfaces over time.
- Choose "See Charts": Select "See Charts" to examine performance trends for the chosen interface over the past day and 7-day periods.
Exercise 5: Path Search for Health Data
Objective: Integrate health and performance data with path search functionality.
- Input Search Criteria: Use the search bar to enter criteria from a previous exercise.
- Select Device: In the path results, choose a device and open the "Device Health" dropdown to view health metrics and charts.
Exercise 6: Interface Health in Path Search
Objective: Analyze interface health within the context of path search results.
- Locate Interfaces: In the L3 section, find ingress/egress interfaces and select an egress interface (e.g.,
gi0/1). - Analyze Performance Data: Click "See charts" to review performance data over time.
Key Insights
- Real-Time Insights: Immediate access to performance data enhances operational responsiveness by allowing for quick understanding and action.
- Historical Context: Historical data aids in trend analysis and long-term planning, providing insights into network behavior patterns.
- Integrated Analysis: Combining performance data with path analysis tools offers a holistic view of network health, supporting informed decision-making.
- Visibility and Insight: Improved visibility into device performance and network flows deepens understanding of network dynamics, aiding optimization and troubleshooting.
- Data-Driven Decisions: Utilizing performance data enables network administrators to make informed decisions for network management and improvement.