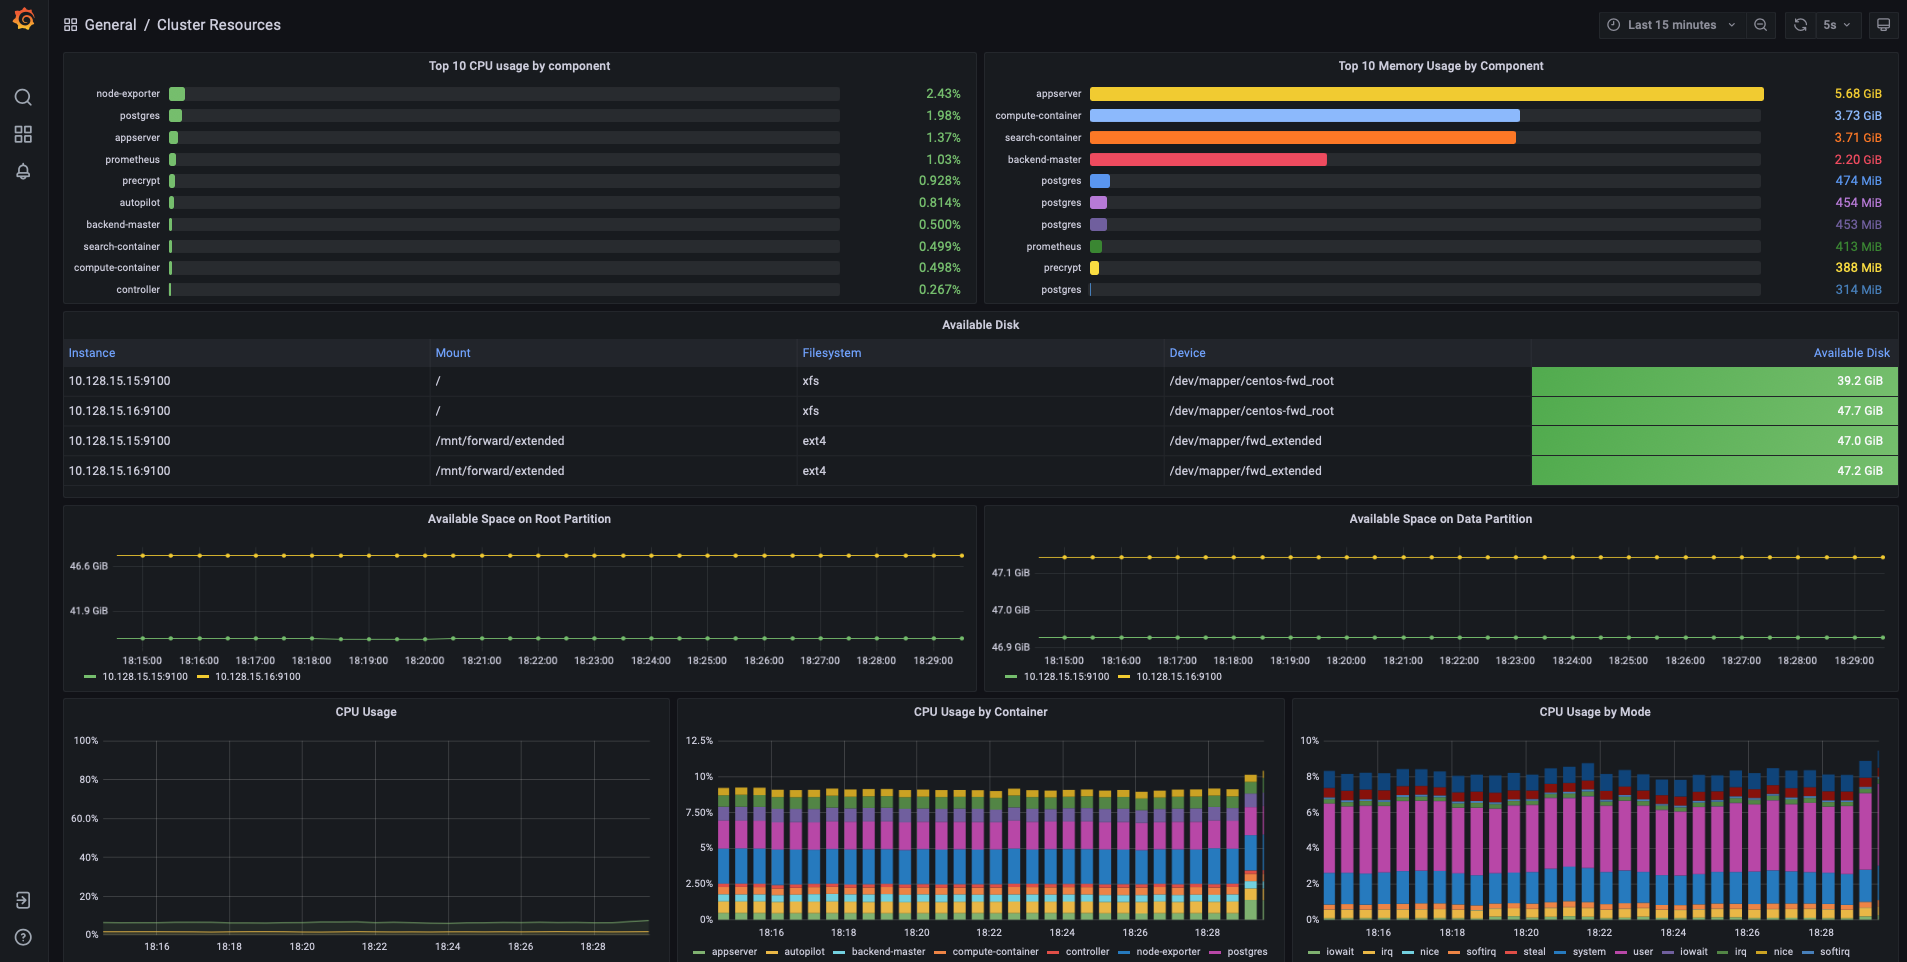
Monitoring Dashboard
To monitor the health of the cluster and its instances, Forward provides a configurable Dashboard based on Grafana
available at https://<PRIMARY_NODE_IP>/monitoring.
Credentials
Viewing the default dashboard is open to anonymous users. Admin users can add more dashboards. The default credentials for the admin password are:
- user:
admin - password:
admin
You will be prompted to change the admin password the first time you log in.