System Overview
The System Overview page provides Forward cluster’s health status, backend jobs information and the NQE Execution status.
Forward Cluster Status
The Status page provides a consolidated view of your Forward cluster’s health, configuration, and resource utilization.
It helps administrators quickly verify cluster status, node details, and the state of platform services.
Access this page from System → System Overview → Status in the left navigation pane.
The page displays real-time information about cluster nodes, storage usage, and running services in the Forward platform.
You can also export the current system state for reporting or troubleshooting.
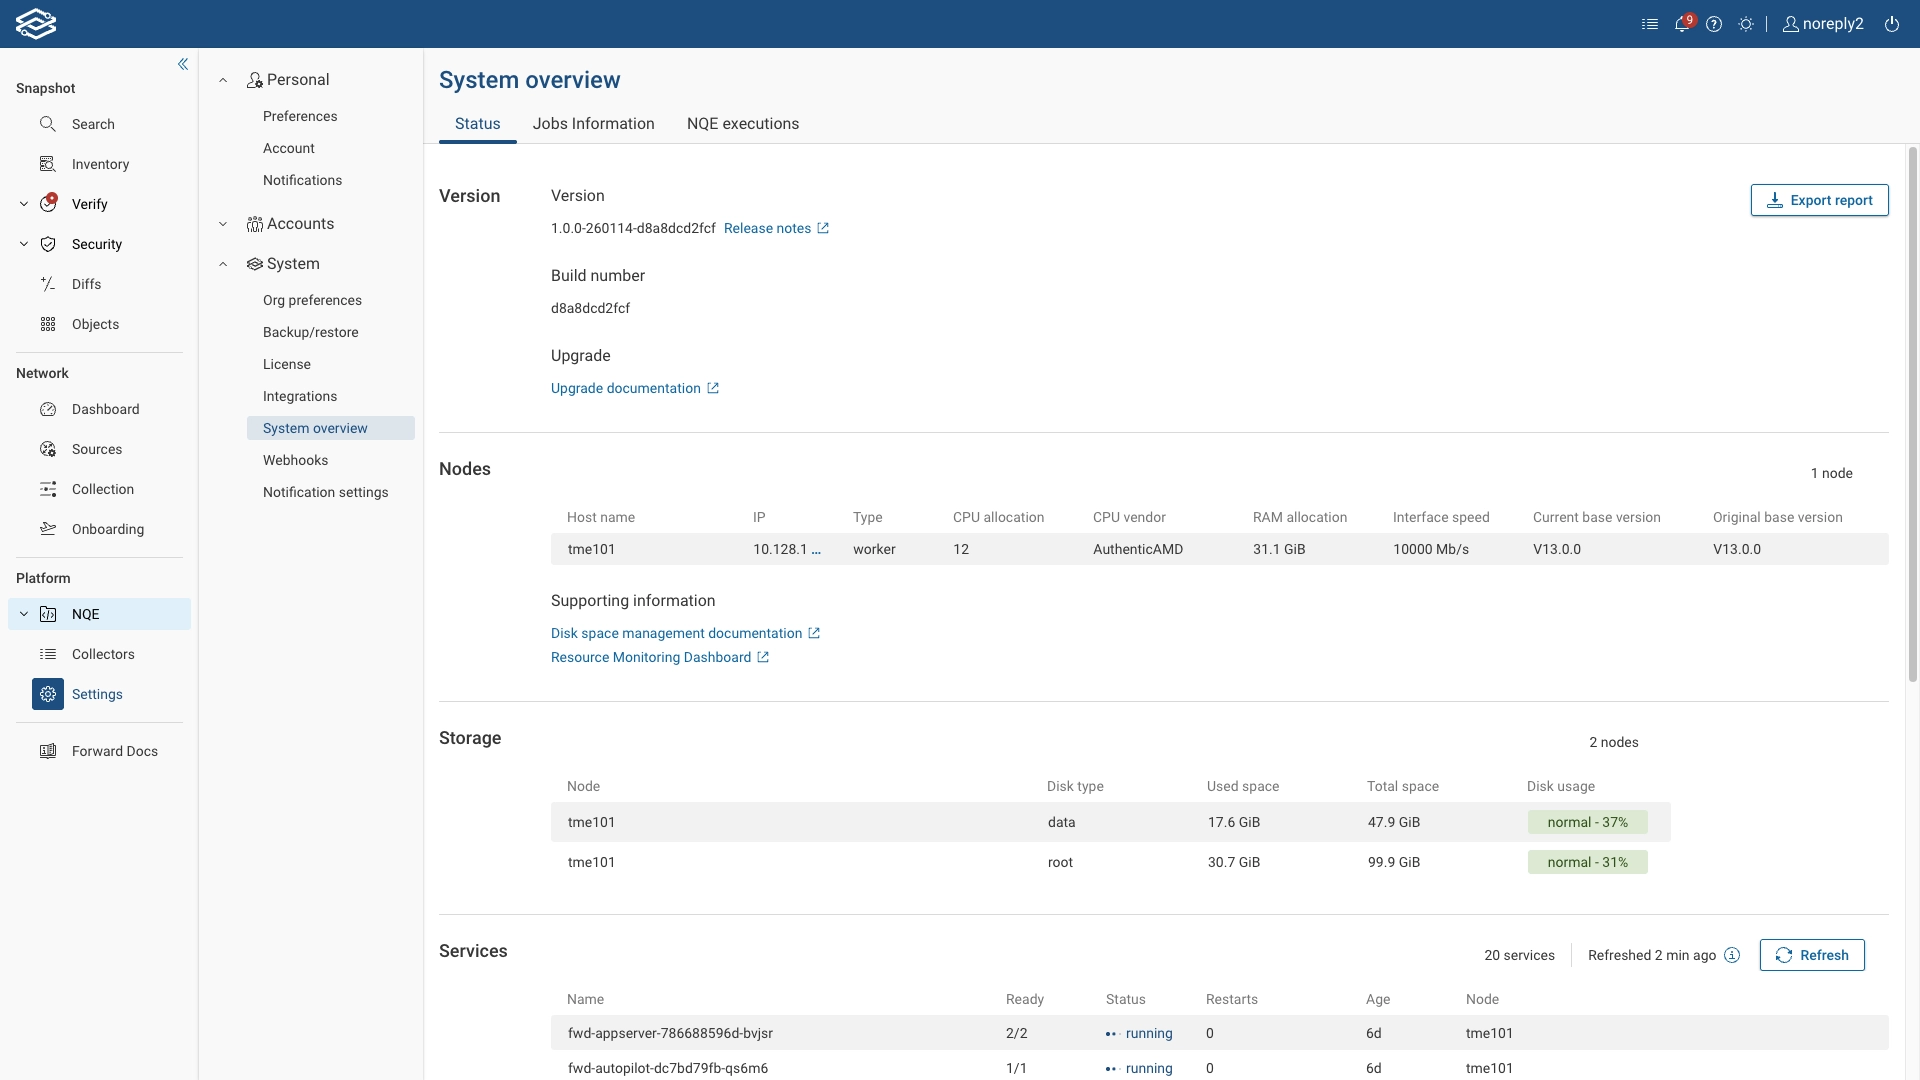
Version Information
At the top of the page, the Version section displays:
- Version – The currently installed Forward release version.
- Build number – Internal build identifier for the deployed release.
- Upgrade – Links to upgrade documentation and release notes.
Node Details
The Nodes section lists all nodes in the cluster along with detailed hardware and configuration information, including:
- Host name and IP address
- Node type (e.g., primary, worker)
- CPU vendor and number of cores
- Configured RAM
- Interface speed
- Current version and original base version
This view provides an at-a-glance summary of cluster composition and node specifications.
Storage Details
The Storage section displays data and root partition usage for each node.
For each disk type, the following details are shown:
- Used space and total capacity
- Usage percentage
- Disk usage status (e.g., normal, warning, critical)
The detailed usage metrics allow administrators to identify potential capacity issues more easily.
Service Status
The Services section lists all active platform services running within the Forward namespace. It includes:
- Service name
- Readiness and status
- Restart count
- Uptime (age)
- Associated node
Each service shows a running status when healthy.
Services that are restarting, crash-looping, or otherwise unhealthy will appear here for visibility and troubleshooting.
Click Refresh to update the list with the latest runtime state.
Exporting Status Reports
Select Export report in the upper-right corner to download a snapshot of the current cluster state.
This report can be shared with Forward Support or used for internal auditing and record-keeping.
Jobs Information
The Jobs Information view provides Forward Org Admins of on-prem deployments with enhanced visibility into backend active and completed jobs, enabling them to quickly identify jobs that may affect overall system performance.
This view includes system backend jobs only. It does not include collector jobs.
Access this page from System → System Overview → Jobs Information in the left navigation pane.
Both views can be updated by clicking on refresh. The system provides an indication of how long ago the view was refreshed.
Active Jobs
The Active view provides the list of jobs currently running in the system.
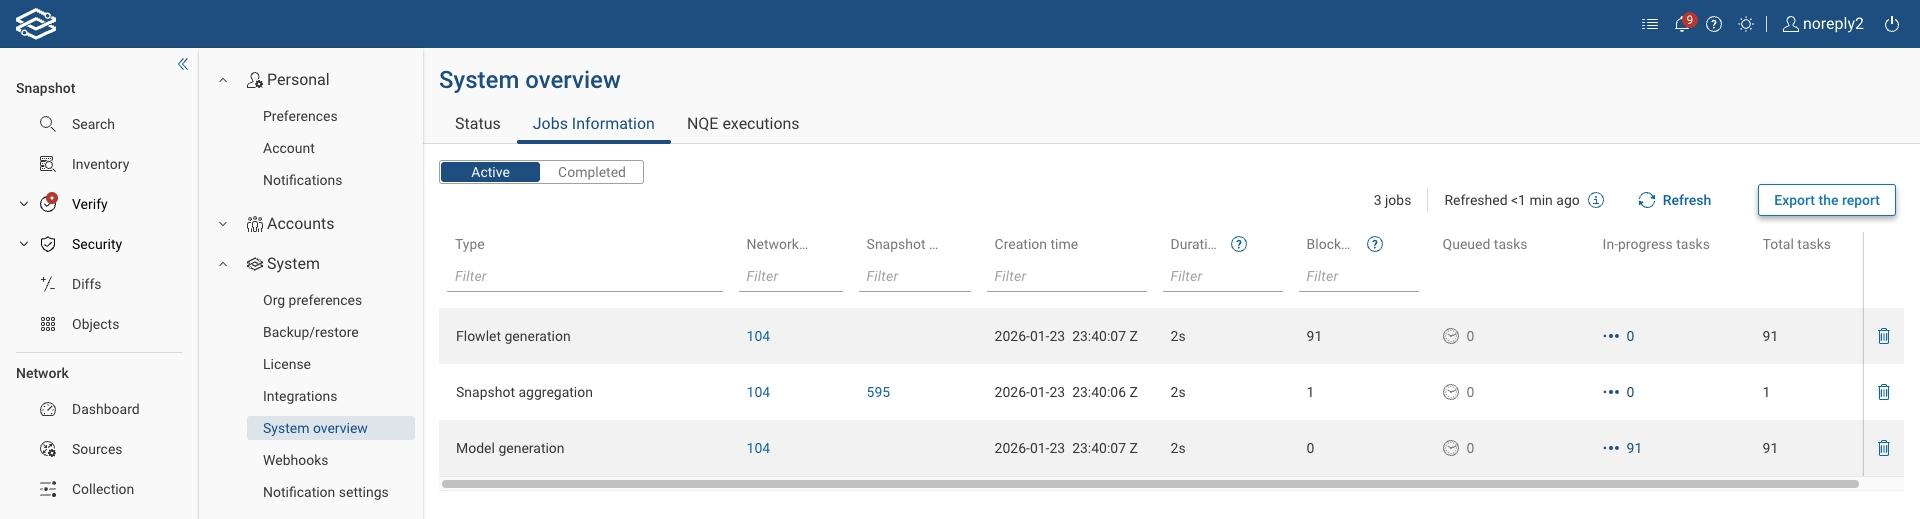
Data points available in this view for each job include:
- Type: Name of the job (e.g., NQE Query Computation, Internet Exposure Analysis, Reachability computation).
- Network ID and Snapshot ID: IDs associated with the job. Note that some job types may not have a Snapshot ID. Diff-related jobs indicate the Snapshot ID of the base snapshot.
- Creation Time: Timestamp when the job was created.
- Duration: Elapsed time from the earliest creation time to the present including time spent waiting for dependencies, waiting in the queue and time since the job started executing.
- Blocked, Queued, In-progress, and Total tasks: Number of tasks in different stages; blocked on dependencies, waiting in queue after all dependencies have executed, currently being executed in the backend, and the total number of tasks associated with the job. A single job in the table represents a group of multiple underlying tasks, for example an NQE Query Computation job can include many individual NQE query tasks. Tasks of the same type for the same snapshot or network are grouped to avoid displaying hundreds or thousands of individual entries.
- Cancel: Clicking on the bin icon cancels all the jobs in the raw.
Completed Jobs
The Completed view displays a list of all jobs that have finished execution.
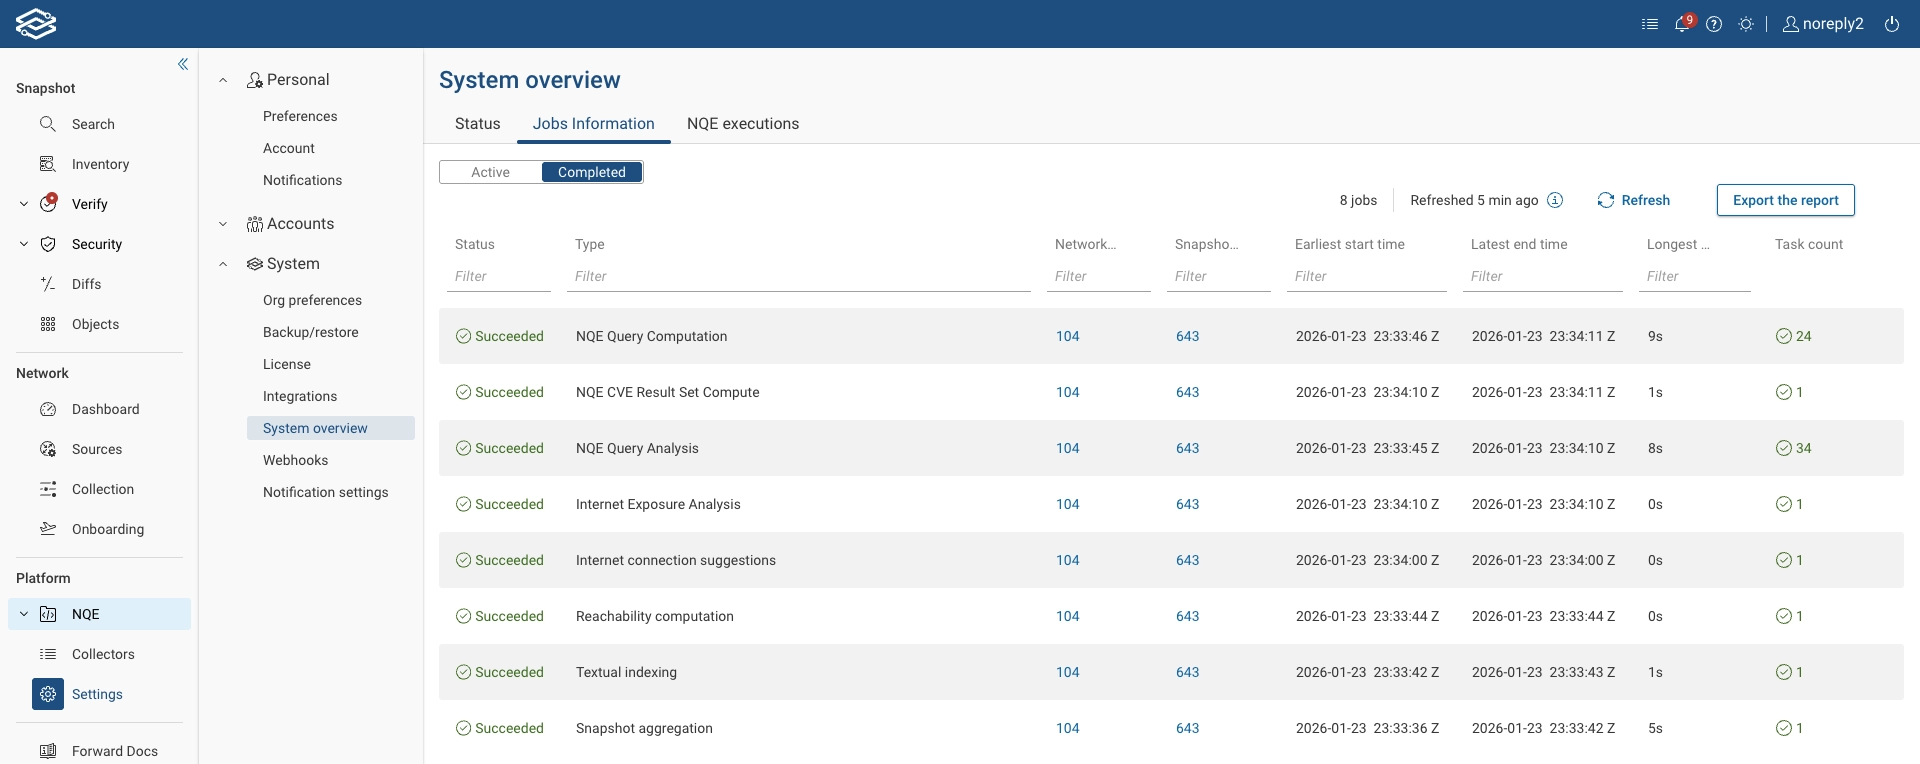
Data points available in this view for each job include:
- Status: Final state of the job, such as Succeeded, Canceled, or failed.
- Type: Name of the job (e.g., NQE Query Computation, Internet Exposure Analysis, Reachability computation).
- Network ID and Snapshot ID: IDs associated with the job. Note that some job types may not have a Snapshot ID. Diff-related jobs indicate the Snapshot ID of the base snapshot.
- Earliest start time and Latest end time: Timestamp of the start time of the first task, and end time of the last task.
- Longest Duration: Duration of the longest-running task, including time spent waiting for dependencies to complete, time spent waiting in queue and time for actual execution.
- Task count: Total number of tasks associated with the job, color-coded based on the job Status.
NQE Executions
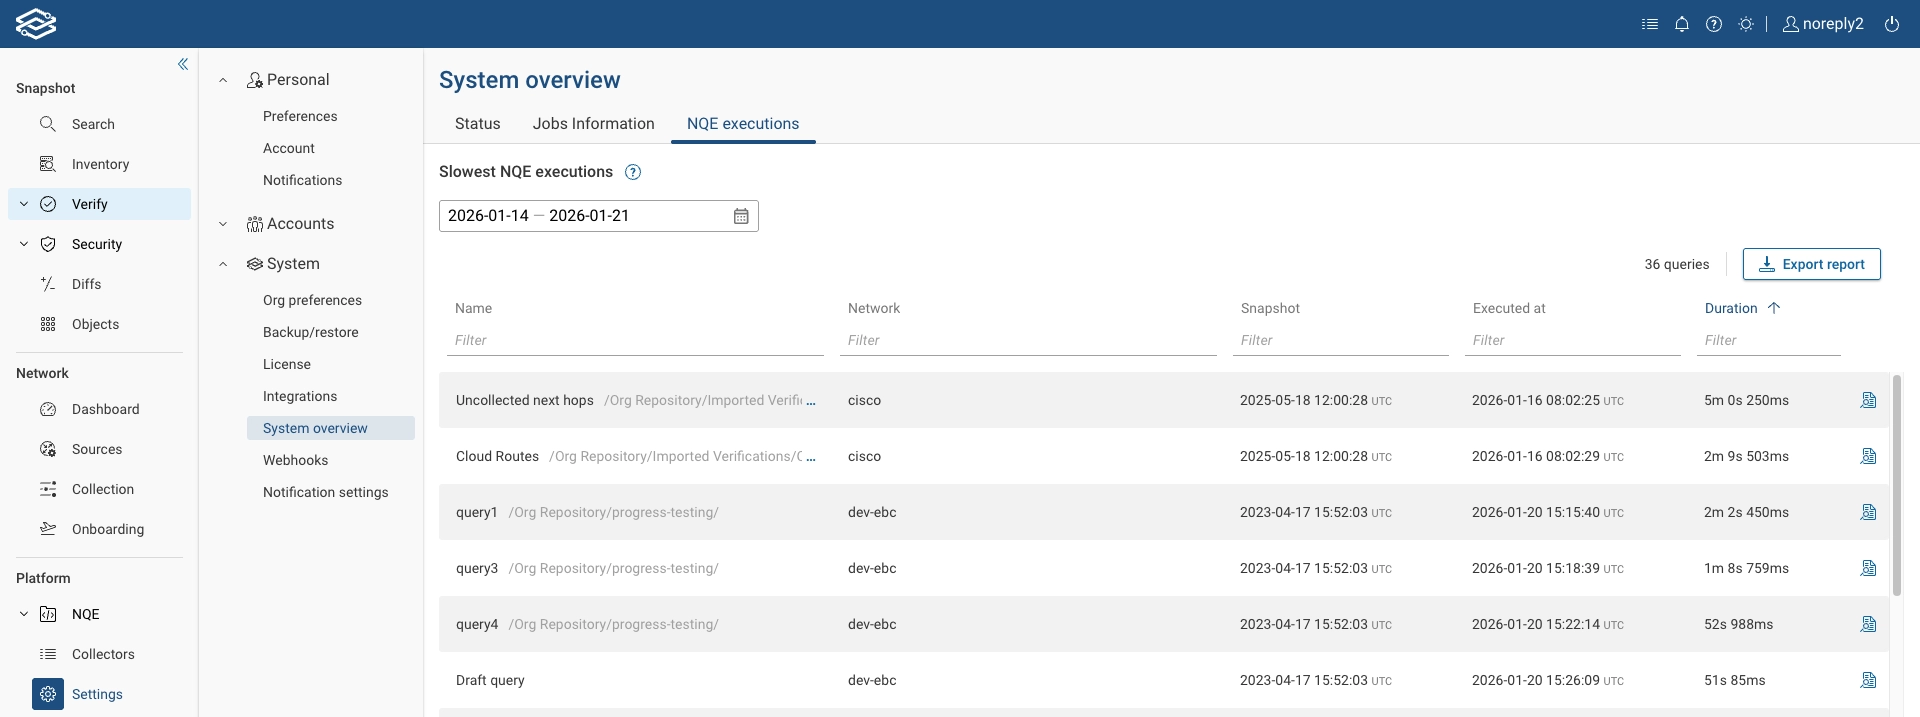
Overview
The NQE Executions view provides Forward Org Admins of on-prem deployments with enhanced visibility into slow-running NQE queries, enabling them to quickly identify and diagnose queries that may affect overall system performance. The view displays the slowest query executions within a selected time range.
NQE queries that are still running are not included in this view. For information on currently running NQE jobs, see the Active Jobs Information view.
Access this page from System → System Overview → NQE Executions in the left navigation pane.
Report Details
The report includes:
- The top 100 slowest executions that took more than 10 seconds to run, ordered from slowest to fastest.
- The time shown represents the actual query execution time; time spent waiting in the queue is not included.
- One row per unique query, even if the query was executed across multiple networks or snapshots. A query may appear more than once if it was modified during the selected time range. Draft queries are included as well.
- The row reflects the slowest execution of that query within the selected period.
Query execution times are retained for 30 days, so the Start date can go back up to 30 days.
For each listed query, you can:
- View the full query contents.
- Open the query in the NQE Library , if the query is saved there.
- Export the data for analysis or for sharing with Forward Customer Success teams.
Exporting NQE Executions Reports
To export a report containing the slowest NQE queries, select Export report in the upper-right corner.
You can choose between two options: Local download or Send to Forward Networks.

The exported report is provided as a ZIP file containing:
- Metrics: An Excel file with all slow queries, regardless of any UI filters. Each row includes additional metadata to help diagnose potential issues.
- Sources: A folder containing the full source text for each query included in the report.
Query results or any other customer data are not included in the report.